Exhibit 99.2
IT’S MORE THAN A GAME.
DISCLAIMER Disclaimer This presentation is provided for informational purposes only and has been prepared to assist interested parties in making th eir own evaluation with respect to a proposed business combination (the “proposed business combination”) between PLAYSTUDIOS, Inc. (“PLAYSTUDIOS” or the “Company”) and Acies Acquisition Corp. (“ Acies ”) and related transactions (the “transactions”), and for no other purpose. This presentation does not constitute an offer to sell or the solicitation of an offer to buy any securities, or a solicitation of any vote or app roval, nor shall there by any sale of securities in any jurisdiction in which such offer, solicitation or sale would be unlawful prior to registration or qualification under the securities laws of any such jurisdiction. No representations or warranties, express or implied, are given in, or in respect of, this presentation. To the fullest exten t p ermitted by law, in no circumstances will PLAYSTUDIOS, Acies or any of their respective subsidiaries, equityholders , affiliates, representatives, partners, directors, officers, employees, advisers or agents be responsible or liable for any dir ect, indirect or consequential loss or loss of profit arising from the use of this presentation, its contents, its omissions, reliance on the information contained within it, or on opinions commun ica ted in relation thereto or otherwise arising in connection therewith. Industry and market data used in this presentation have been obtained from third - party industry publications and sources as well as from research reports prepared for other purposes. Neither PLAYSTUDIOS nor Acies has independently verified the data obtained from these sources and cannot assure you of the data’s accuracy or completeness. T his data is subject to change. In addition, this presentation does not purport to be all - inclusive or to contain all of the information that may be required to make a full analysis of PLAYSTUDIOS or the propose d business combination. You are urged to make your own evaluation of PLAYSTUDIOS and such other investigations as you deem necessary before making an investment or voting decision. Forward Looking Statements This presentation and the related oral commentary include “forward - looking statements” within the meaning of the “safe harbor” p rovisions of the United States Private Securities Litigation Reform Act of 1995. Forward - looking statements may be identified by the use of words such as “estimate,” “plan,” “project,” “forecast,” “intend,” “w ill,” “expect,” “anticipate,” “believe,” “seek,” “target” or other similar expressions that predict or indicate future events or trends or that are not statements of historical matters. These forward - looking statements i nclude, but are not limited to, statements regarding estimates and forecasts of financial and performance metrics, projections of market opportunity, total addressable market (TAM), market share and competition, exp ect ations and timing related to commercial product launches, the potential success of PLAYSTUDIOS’ M&A strategy and the integration of those acquisitions, and expectations related to the terms and timing of the tra nsactions. These statements are based on various assumptions, whether or not identified in this presentation, and on the current expectations of PLAYSTUDIOS’ and Acies ’ management and are not predictions of actual performance. These forward - looking statements are provided for illustrative purposes only and are not intended to serve as, and must not be relied on by any investor as, a guarantee, an assurance, a pr edi ction or a definitive statement of fact or probability. Actual events and circumstances are difficult or impossible to predict, will differ from assumptions and are beyond the control of PLAYSTUDIOS and Acies . These forward - looking statements are subject to a number of risks and uncertainties, including changes in domestic and foreign b usiness, market, financial, political and legal conditions; the inability of the parties to successfully or timely consummate the proposed business combination, including the risk that any required regulatory approval s a re delayed or not obtained or that the approval of the shareholders of PLAYSTUDIOS or Acies is not obtained; failure to realize the anticipated benefits of the proposed business combination; future global, regional or l ocal economic, political, market and social conditions, including due to the COVID - 19 pandemic; the development, effects and enforcement of laws and regulations, including with respect to the gaming industry; PL AYSTUDIOS’ ability to manage its future growth or to develop or acquire new games and make enhancements to its platform; the effects of competition on PLAYSTUDIOS’ future business; the amount of redemption r equ ests made by Acies ’ public shareholders; the outcome of any potential litigation, government and regulatory proceedings, investigations and inquiries; the ability to implement business plans, forecasts and o the r expectations after the completion of the proposed transaction and identify and realize additional opportunities; failure to realize anticipated benefits of the transaction or to realize estimated forecast s a nd projections; or other risks and uncertainties indicated from time to time in the registration statement containing the proxy statement/prospectus discussed below relating to the proposed business combinatio n, including those under “Risk Factors” therein, and in Acies ’ other filings with the SEC. The foregoing list of factors is not exclusive, and readers should also refer to those risks that will be included under th e header “Risk Factors” in the registration statement on Form S - 4 to be filed by Acies with the SEC and those included under the header “Risk Factors” in the final prospectus of Acies related to its initial public offering dated October 22, 2020. You are cautioned not to place undue reliance upon any forward - looking statements in this presentation, which speak only as of the date made. PLAYSTUDIOS and Acies do not undertake or accept any obligation or undertaking to release publicly any updates or revisions to any forward - looking statements in this press release to reflect any change in its expectations or any change in events, condi tions or circumstances on which any such statement is based.
DISCLAIMER (continued) Use of Projections This presentation contains projected financial information with respect to PLAYSTUDIOS, including revenue, cost of sales, use r a cquisition costs, other expenses and Adjusted EBITDA. Such projected financial information constitutes forward - looking information, is for illustrative purposes only and should not be relied upon as necessar ily being indicative of future results. The assumptions and estimates underlying such projected financial information are inherently uncertain and are subject to a wide variety of significant business, economic, co mpetitive and other risks and uncertainties that could cause actual results to differ materially from those contained in the projected financial information. See “Forward - Looking Statements” above. Actual results m ay differ materially from the results contemplated by the projected financial information contained in this presentation, and the inclusion of such information in this presentation should not be regarded as a representation by any person that the results reflected in such projections will be achieved. Neither the independent auditors of PLAYSTUDIOS or Acies audited, reviewed, compiled, or performed any procedures with respect to the projections for the purpose of their inclusion i n this presentation, and accordingly, neither of them expressed an opinion or provided any other form of assurance with respect thereto for the pu rpo se of this presentation. Financial Information; Non - GAAP Financial Measures The financial information and data contained in this presentation is unaudited and does not conform to the requirements of Re gul ation S - X. Accordingly, such information and data may not be included in, may be adjusted in or may be presented differently in, any proxy statement, registration statement or prospectus to be filed by Acies with the SEC. In addition, all PLAYSTUDIOS historical financial information included herein is preliminary and subject to change, including in connection with the audit of the financial statements. Some of the financi al information and data contained in this presentation, such as Adjusted EBITDA (AEBITDA), have not been prepared in accordance with United States generally accepted accounting principles (“GAAP”). Adjusted EBITDA is de fined as net income before interest, income taxes, depreciation and amortization and before costs capitalized for internal - use software projects, restructuring (consisting primarily of severance and other rest ructuring related costs), stock - based compensation expense, and other income and expense items (including unusual items, foreign currency gains and losses, and other non - cash items). PLAYSTUDIOS and Acies believe that the use of Adjusted EBITDA provides an additional tool to assess operational performance and trends in, and in comparing PLAYSTUDIOS’ financial measures with, other similar companies, many of which pres ent similar non - GAAP financial measures to investors. PLAYSTUDIOS’ non - GAAP financial measures may be different from non - GAAP financial measures used by other companies. The presentation of non - GAAP finan cial measures is not intended to be considered in isolation or as a substitute for, or superior to, financial measures determined in accordance with GAAP. The principal limitation of Adjusted EBITDA is that it ex cludes significant expenses and income that are required by GAAP to be recorded in PLAYSTUDIOS’ financial statements. A reconciliation of Adjusted EBITDA to the most directly comparable GAAP measure cannot be pr ovided without unreasonable effort because of the inherent difficulty of accurately forecasting the occurrence and financial impact of the various adjusting items necessary for such reconciliations tha t have not yet occurred, are out of PLAYSTUDIOS’ control or cannot be reasonably predicted. For the same reasons, PLAYSTUDIOS is unable to provide probable significance of the unavailable information, which co uld be material to future results. Because of the limitations of non - GAAP financial measures, you should consider the non - GAAP financial measures presented in this presentation in conjunction with PLAYSTUDIOS’ au dited financial statements and the related notes thereto. No Offer or Solicitation This press release shall not constitute a solicitation of a proxy, consent or authorization with respect to any securities or in respect of the proposed transaction. This press release shall also not constitute an offer to sell or the solicitation of an offer to buy any securities, nor shall there be any sale of securities in any states or jurisd ict ions in which such offer, solicitation or sale would be unlawful prior to registration or qualification under the securities laws of any such jurisdiction. No offering of securities shall be made except by means of a p rospectus meeting the requirements of Section 10 of the Securities Act of 1933, as amended.
DISCLAIMER (continued) Additional Information In connection with the proposed business combination, Acies intends to file a registration statement on Form S - 4 with the Securities and Exchange Commission (the “SEC”), which will includ e a proxy statement/prospectus, that will be both the proxy statement to be distributed to holders of Acies ’ ordinary shares in connection with its solicitation of proxies for the vote by Acies ’ shareholders with respect to the proposed business combination and other matters as may be described in the registration statement, as well as the prospectus relating to the offer and sale of the securities to be issued in the business combination. After the registration statement is declared effective, Acies will mail a definitive proxy statement/prospectus and other relevant documents to its stockholders. This document does not contain all the information that should be considered concerning the proposed business combination and is not intend ed to form the basis of any investment decision or any other decision in respect of the business combination. Acies ’ shareholders, the Company’s stockholders and other interested persons are advised to read, when available, the preliminary pro xy statement/prospectus included in the registration statement and the amendments thereto and the definitive proxy statement/prospectus and other doc ume nts filed in connection with the proposed business combination, as these materials will contain important information about the Company, Acies and the business combination. When available, the definitive proxy statement/prospectus and other relevant materials for the proposed business combination will be mailed to stockholders of Acies as of a record date to be established for voting on the proposed business combination. Acies ’ shareholders and the Company’s stockholders will also be able to obtain copies of the proxy statement / prospectus and other documents filed with the SEC, w ith out charge, once available, at the SEC’s website at www.sec.gov . INVESTMENT IN ANY SECURITIES DESCRIBED HEREIN HAS NOT BEEN APPROVED OR DISAPPROVED BY THE SEC OR ANY OTHER REGULATORY AUTHORI TY NOR HAS ANY AUTHORITY PASSED UPON OR ENDORSED THE MERITS OF THE OFFERING OR THE ACCURACY OR ADEQUACY OF THE INFORMATION CONTAINED HEREIN. ANY REPRESENTATION TO THE CONTRARY IS A CRIMINAL OFFENSE. Participants in the Solicitation Acies and PLAYSTUDIOS and their respective directors and officers may be deemed participants in the solicitation of proxies of Acies ’ shareholders in connection with the proposed business combination. A list of the names of such directors and executive officers and information regarding their interests in the business combination will be con tained in the proxy statement/prospectus when available. You may obtain free copies of these documents as described in the preceding paragraph. Trademarks This presentation contains trademarks, service marks, trade names and copyrights of Acies , PLAYSTUDIOS and other companies, which are the property of their respective owners.
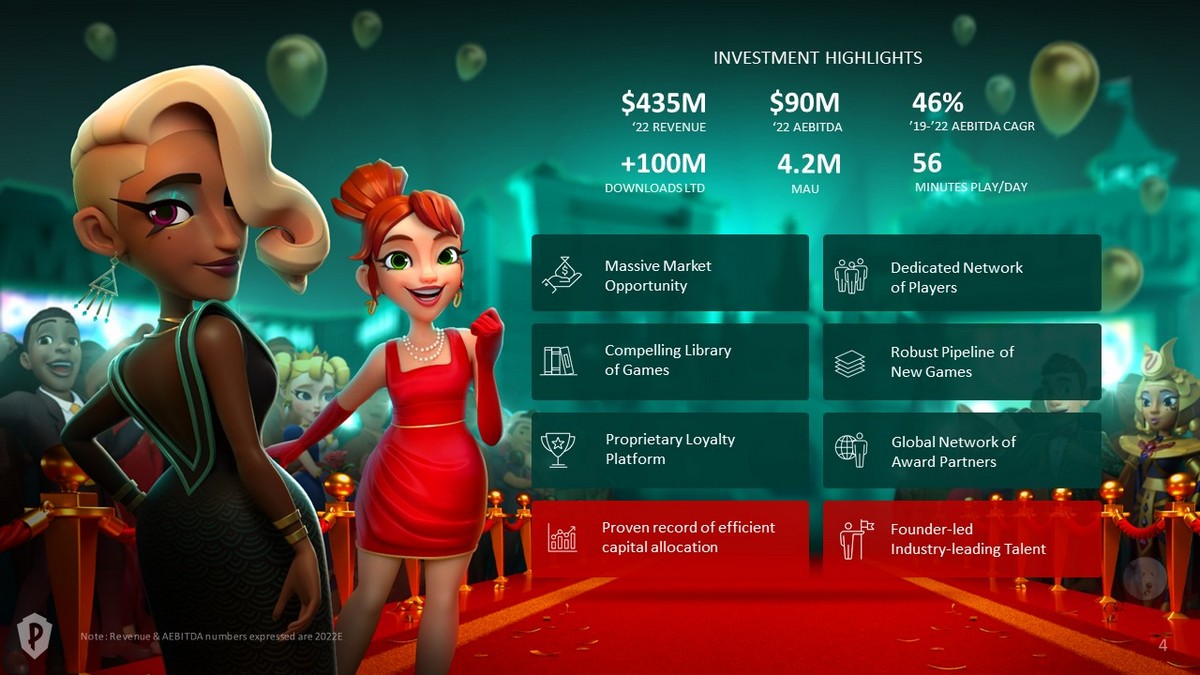
Robust Pipeline of New Games Founder - led Industry - leading Talent Massive Market Opportunity Compelling Library of Games Proven record of efficient capital allocation Proprietary Loyalty Platform Global Network of Award Partners Dedicated Network of Players $90M ‘22 AEBITDA 4.2M MAU 46% ’19 - ’22 AEBITDA CAGR 56 MINUTES PLAY/DAY $435M ‘22 REVENUE +100M DOWNLOADS LTD INVESTMENT HIGHLIGHTS

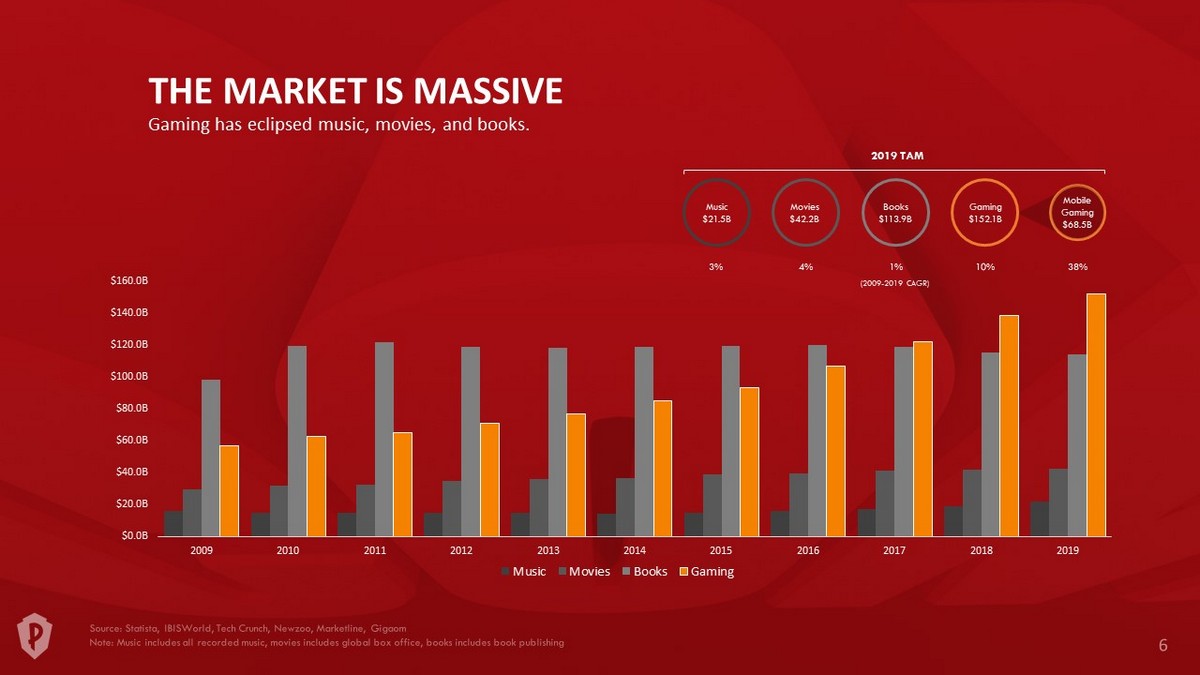
$0.0B $20.0B $40.0B $60.0B $80.0B $100.0B $120.0B $140.0B $160.0B 2009 2010 2011 2012 2013 2014 2015 2016 2017 2018 2019 Music Movies Books Gaming THE MARKET IS MASSIVE Gaming has eclipsed music, movies, and books. 2019 TAM (2009 - 2019 CAGR) Music $21.5B 3% Movies $42.2B 4% Books $113.9B 1% Gaming $152.1B 10% 38% Mobile Gaming $68.5B
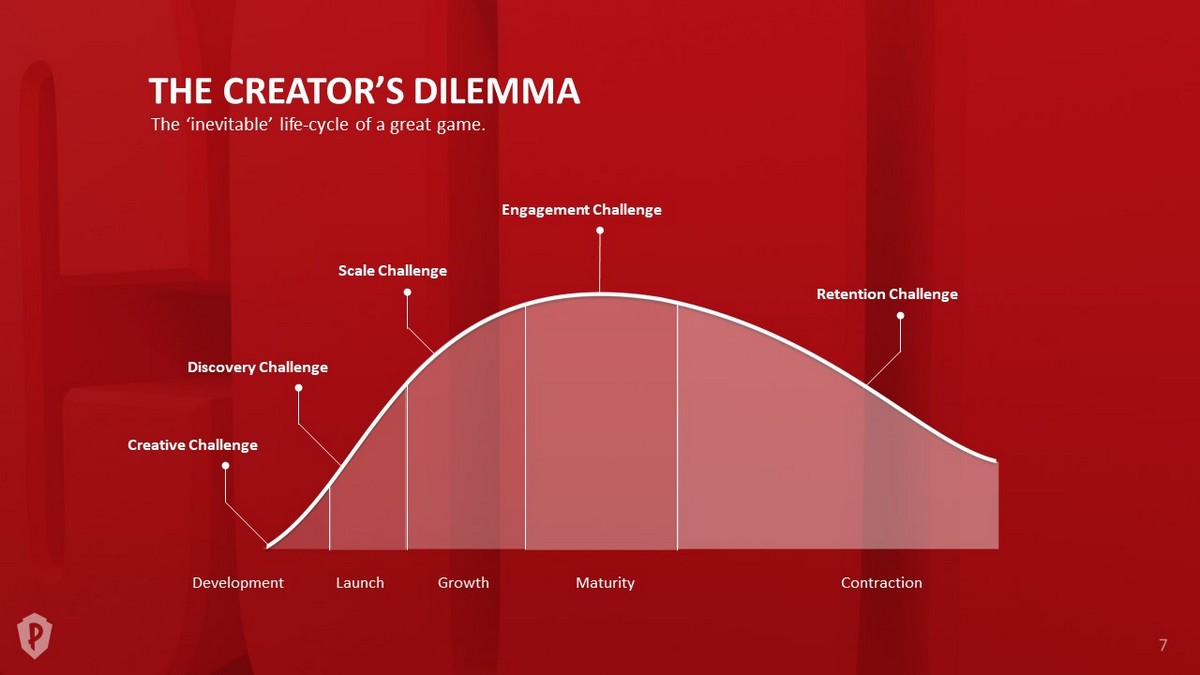
THE CREATOR’S DILEMMA The ‘inevitable’ life - cycle of a great game. Development Launch Growth Maturity Contraction Creative Challenge Discovery Challenge Scale Challenge Engagement Challenge Retention Challenge
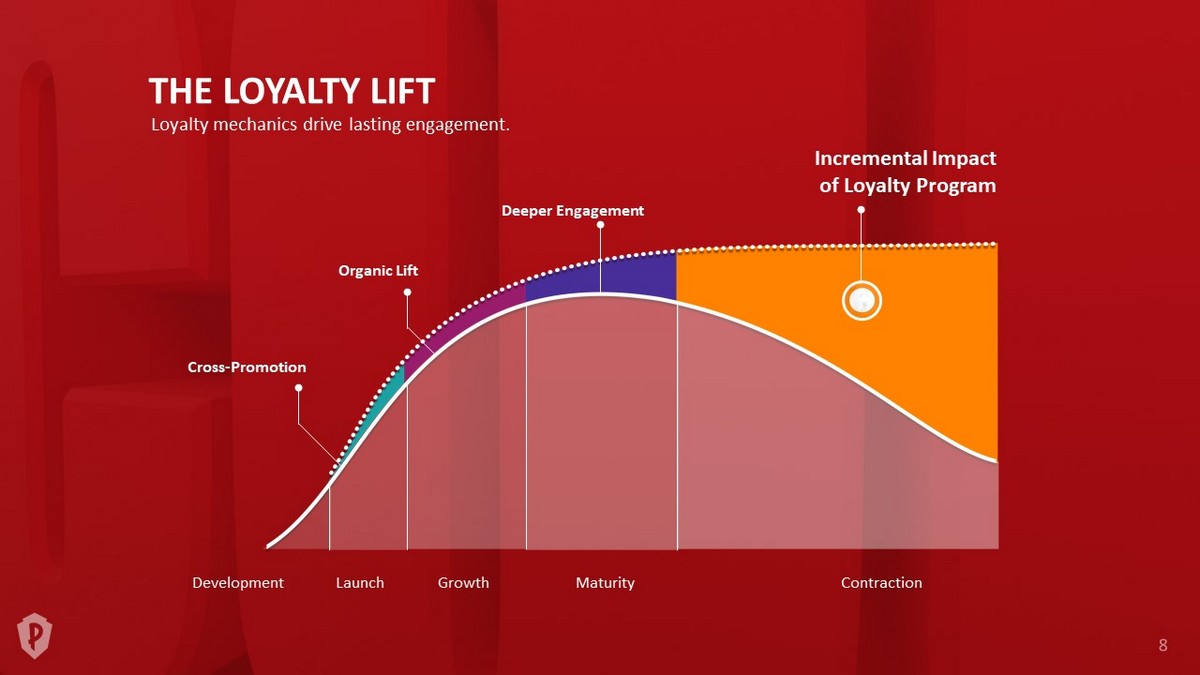
THE LOYALTY LIFT Loyalty mechanics drive lasting engagement. Incremental Impact of Loyalty Program Cross - Promotion Organic Lift Deeper Engagement Development Launch Growth Maturity Contraction
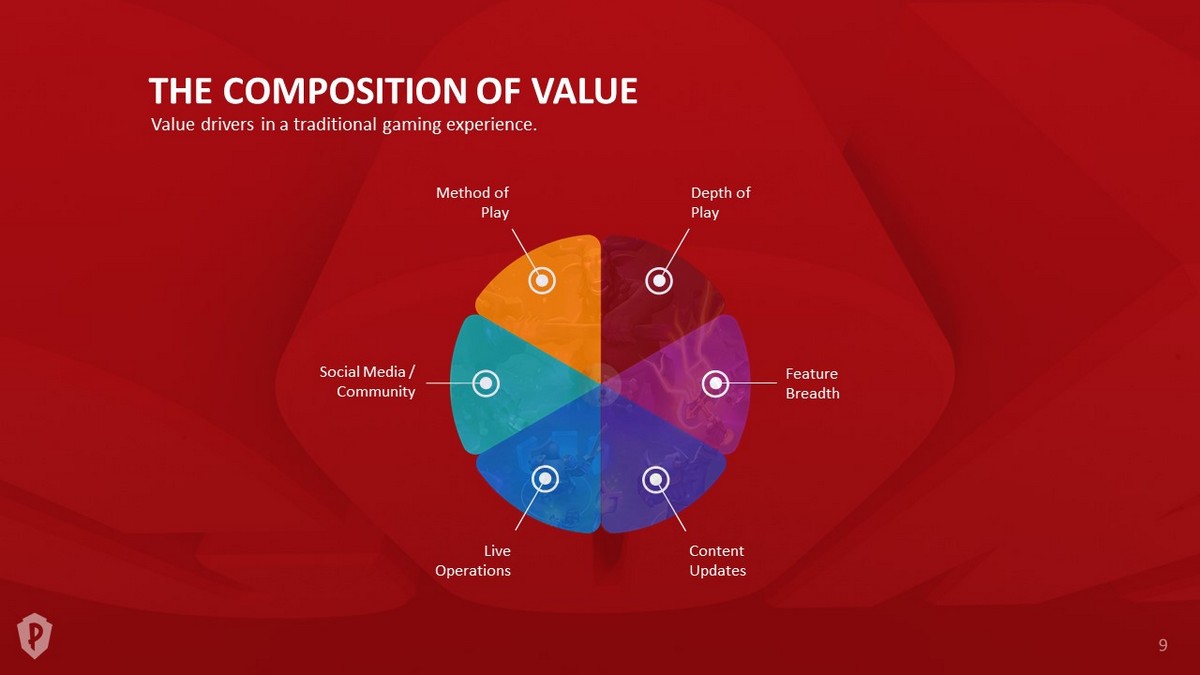
THE COMPOSITION OF VALUE Value drivers in a traditional gaming experience. Method of Play Social Media / Community Live Operations Content Updates Feature Breadth Depth of Play
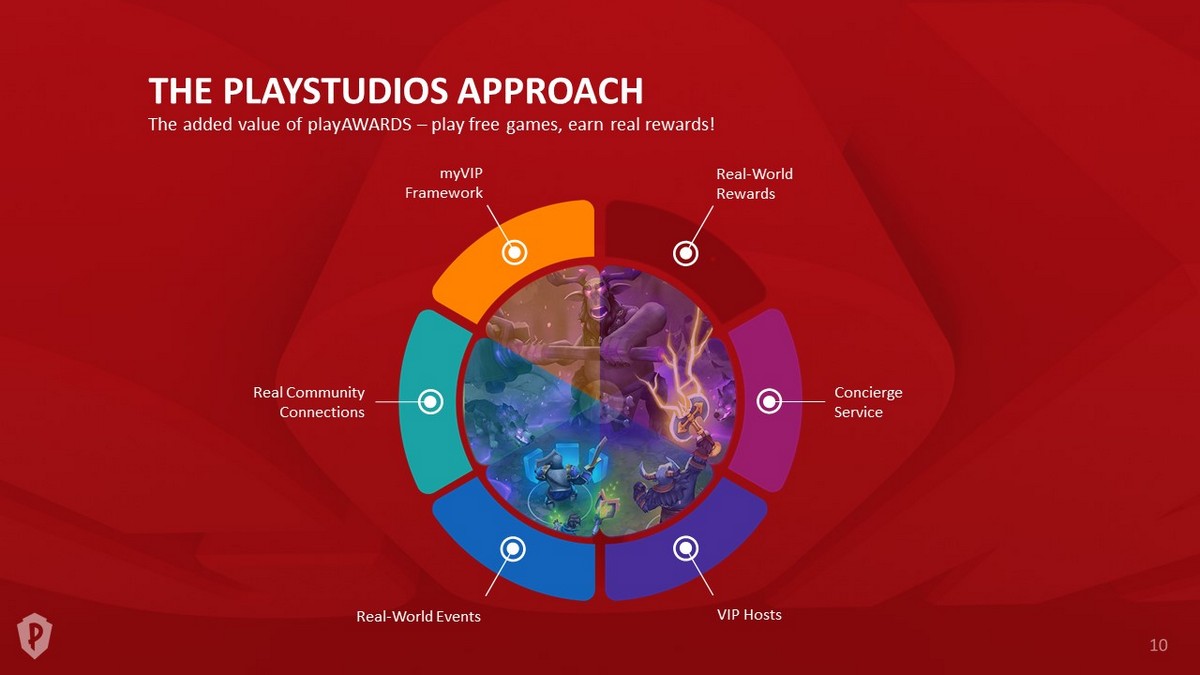
THE PLAYSTUDIOS APPROACH The added value of playAWARDS – play free games, earn real rewards! Concierge Service Real - World Rewards Real - World Events Real Community Connections myVIP Framework VIP Hosts

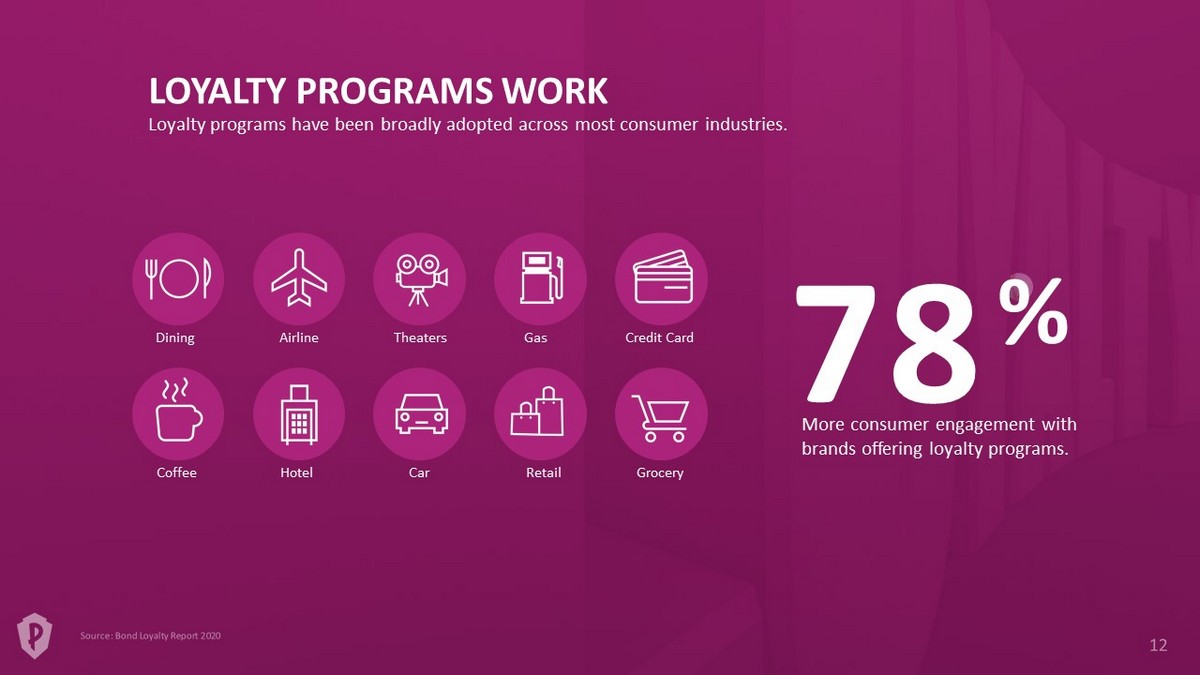
More consumer engagement with brands offering loyalty programs. Hotel Grocery Retail Theaters Dining Airline Car Coffee Gas Credit Card LOYALTY PROGRAMS WORK Loyalty programs have been broadly adopted across most consumer industries. 8 % 7
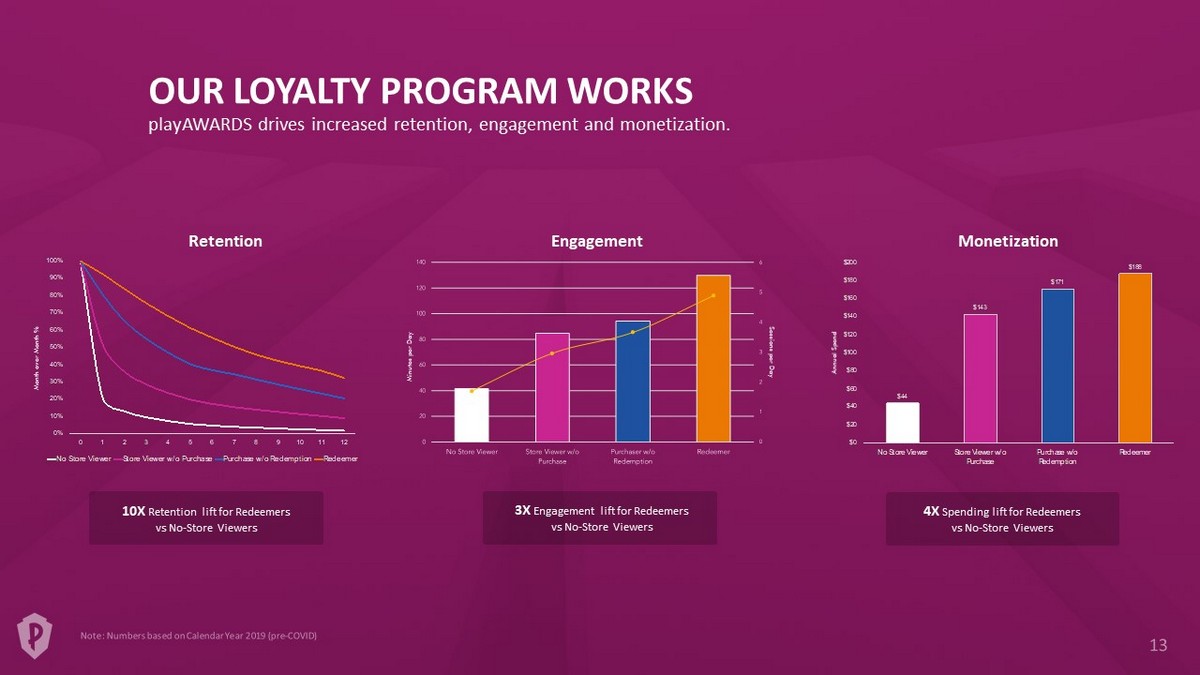
0% 10% 20% 30% 40% 50% 60% 70% 80% 90% 100% 0 1 2 3 4 5 6 7 8 9 10 11 12 No Store Viewer Store Viewer w/o Purchase Purchase w/o Redemption Redeemer OUR LOYALTY PROGRAM WORKS playAWARDS drives increased retention, engagement and monetization. Engagement Retention 10X Retention lift for Redeemers vs No - Store Viewers 4X Spending lift for Redeemers vs No - Store Viewers Minutes per Day Sessions per Day Month over Month % $44 $143 $171 $188 $0 $20 $40 $60 $80 $100 $120 $140 $160 $180 $200 No Store Viewer Store Viewer w/o Purchase Purchase w/o Redemption Redeemer Monetization Annual Spend 3X Engagement lift for Redeemers vs No - Store Viewers
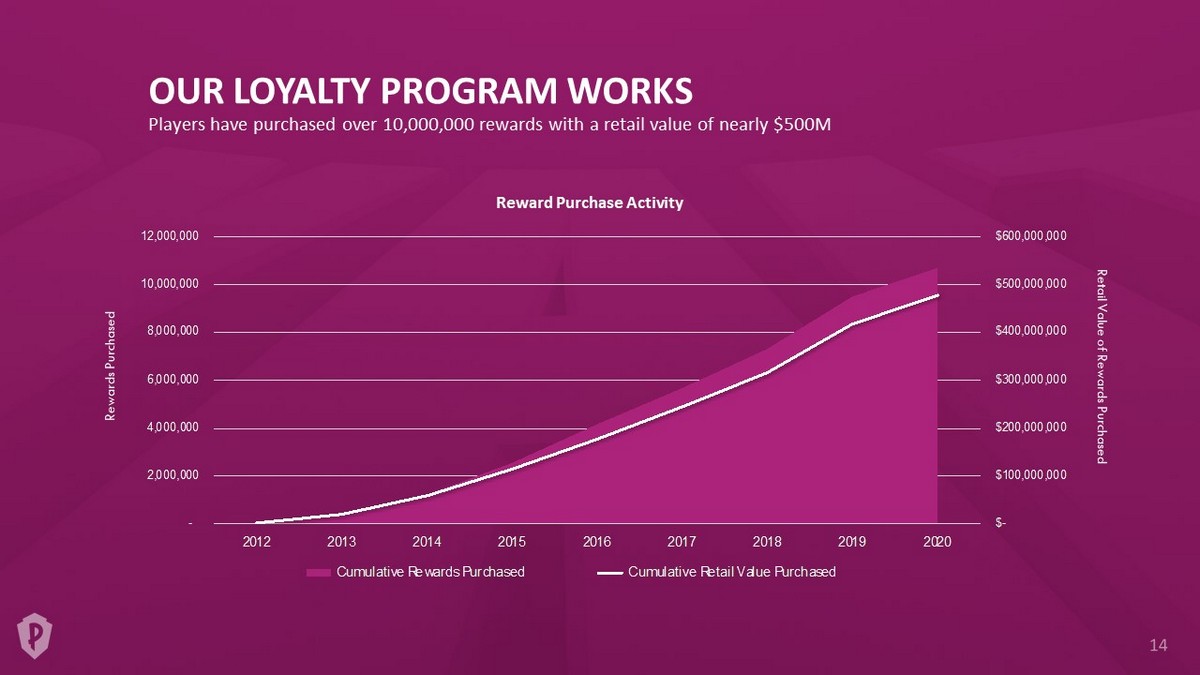
$- $100,000,000 $200,000,000 $300,000,000 $400,000,000 $500,000,000 $600,000,000 - 2,000,000 4,000,000 6,000,000 8,000,000 10,000,000 12,000,000 2012 2013 2014 2015 2016 2017 2018 2019 2020 Cumulative Rewards Purchased Cumulative Retail Value Purchased OUR LOYALTY PROGRAM WORKS Players have purchased over 10,000,000 rewards with a retail value of nearly $500M Reward Purchase Activity Retail Value of Rewards Purchased Rewards Purchased
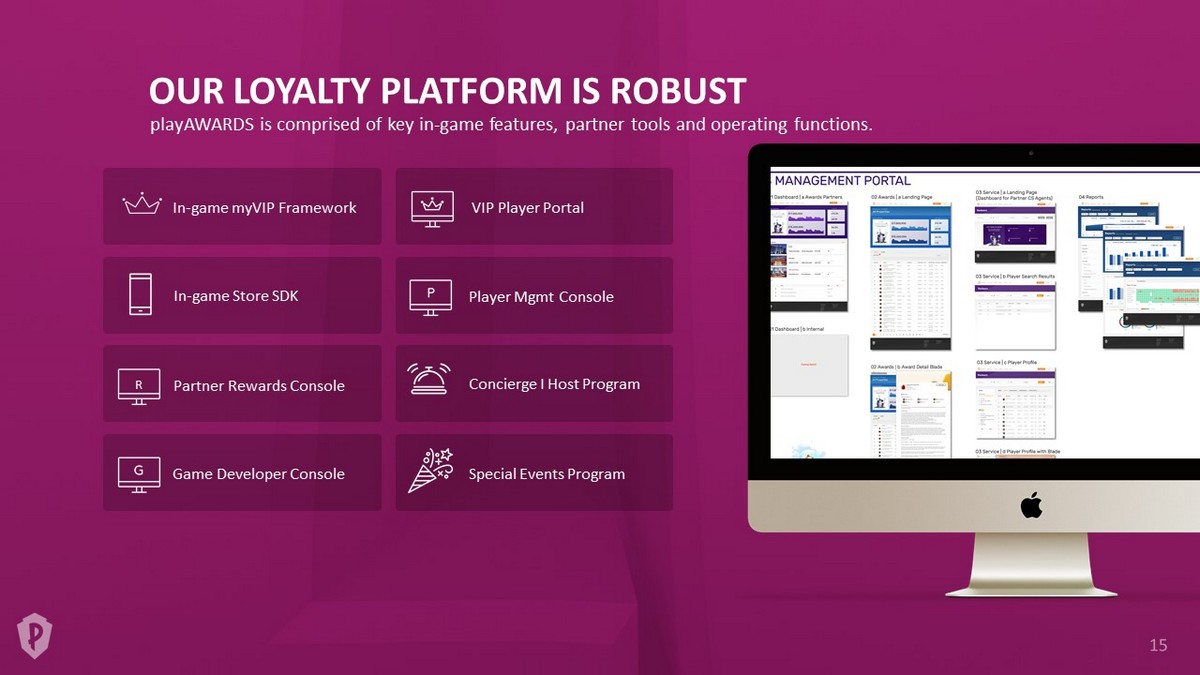
OUR LOYALTY PLATFORM IS ROBUST playAWARDS is comprised of key in - game features, partner tools and operating functions. VIP Player Portal Player Mgmt Console Special Events Program Concierge I Host Program In - game myVIP Framework In - game Store SDK Game Developer Console Partner Rewards Console R
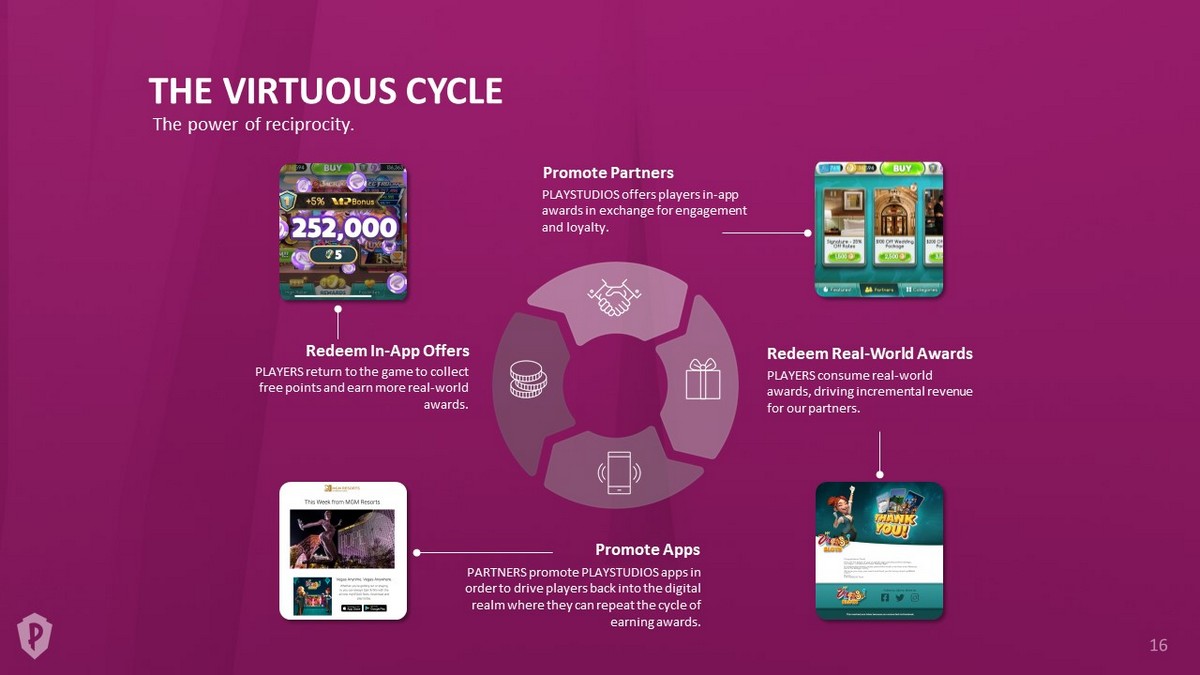
THE VIRTUOUS CYCLE Promote Partners PLAYSTUDIOS offers players in - app awards in exchange for engagement and loyalty. Redeem Real - World Awards PLAYERS consume real - world awards, driving incremental revenue for our partners. Redeem In - App Offers PLAYERS return to the game to collect free points and earn more real - world awards. Promote Apps PARTNERS promote PLAYSTUDIOS apps in order to drive players back into the digital realm where they can repeat the cycle of earning awards. The power of reciprocity.
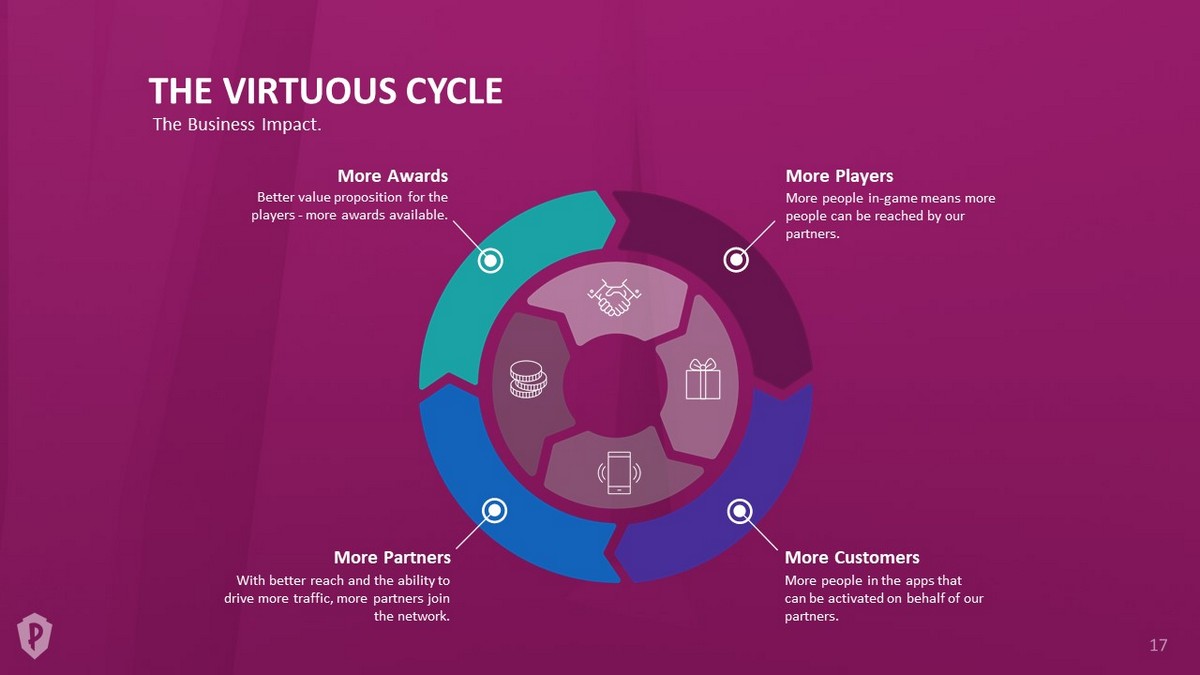
THE VIRTUOUS CYCLE More people in - game means more people can be reached by our partners. More Players More people in the apps that can be activated on behalf of our partners. More Customers With better reach and the ability to drive more traffic, more partners join the network. More Partners Better value proposition for the players - more awards available. More Awards The Business Impact.
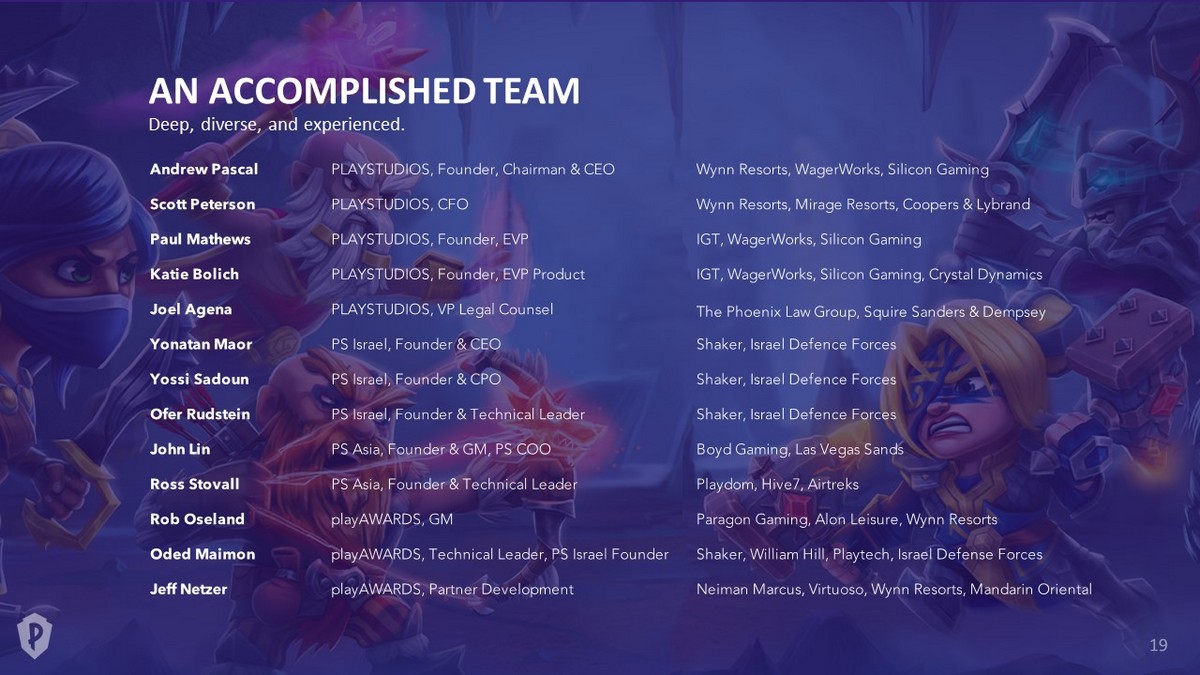
AN ACCOMPLISHED TEAM Deep, diverse, and experienced.
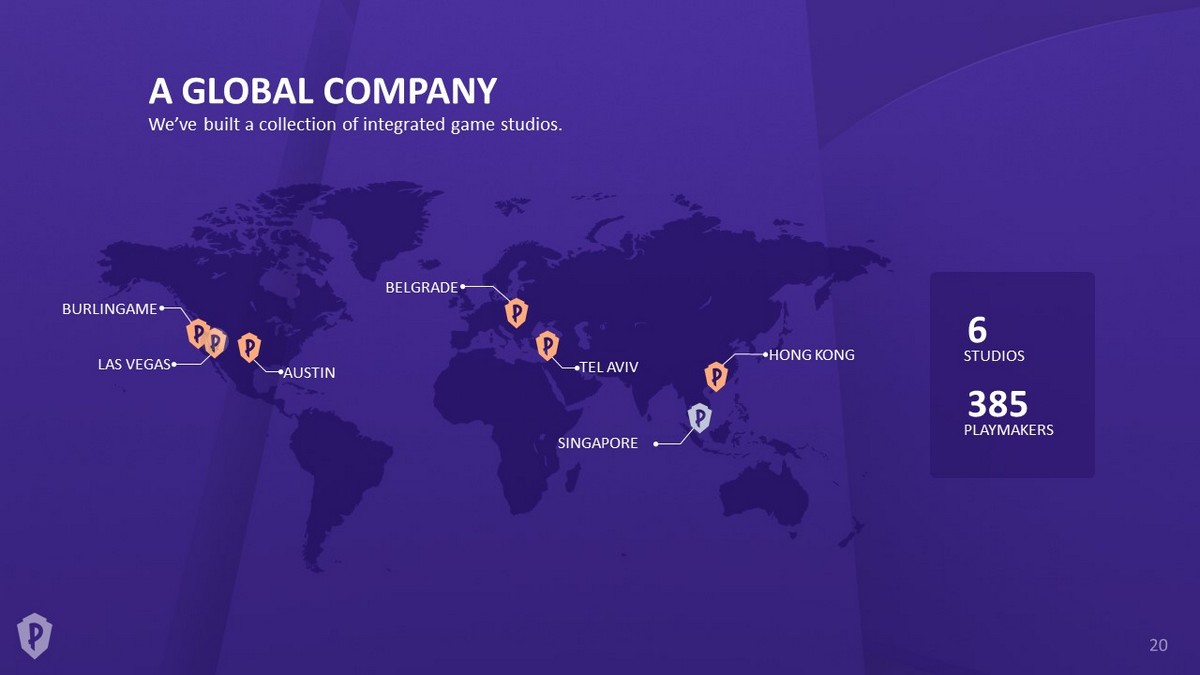
A GLOBAL COMPANY BURLINGAME LAS VEGAS AUSTIN BELGRADE TEL AVIV HONG KONG SINGAPORE STUDIOS 6 PLAYMAKERS 385 We’ve built a collection of integrated game studios.
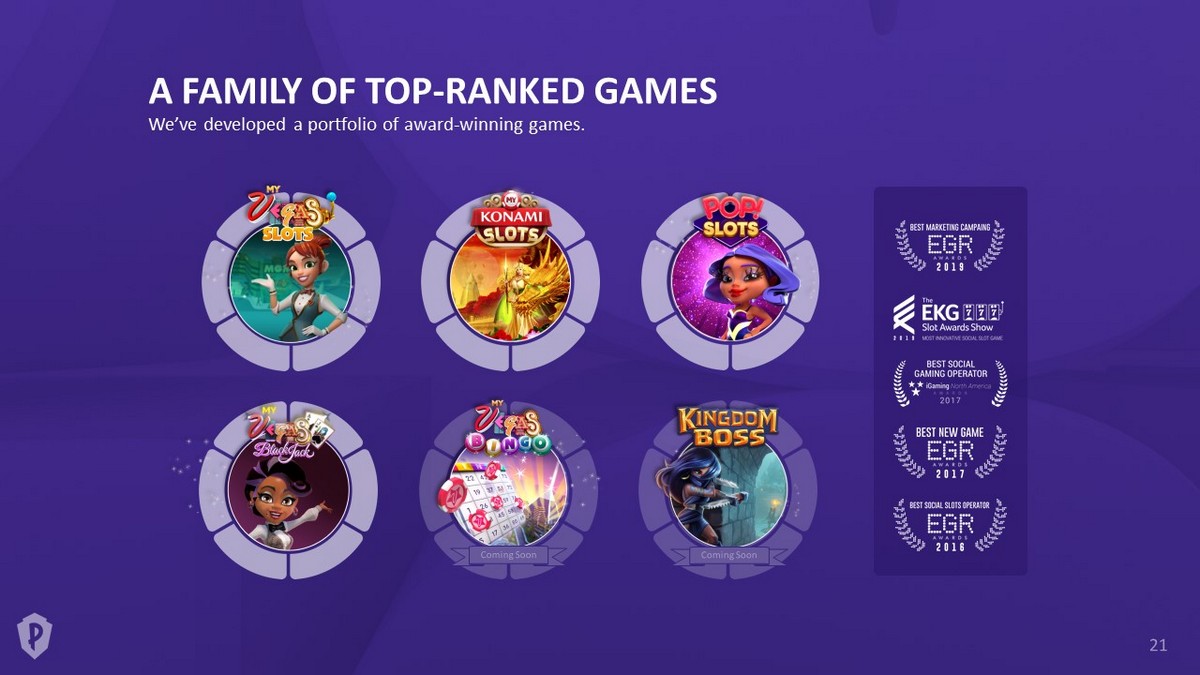
A FAMILY OF TOP - RANKED GAMES We’ve developed a portfolio of award - winning games.
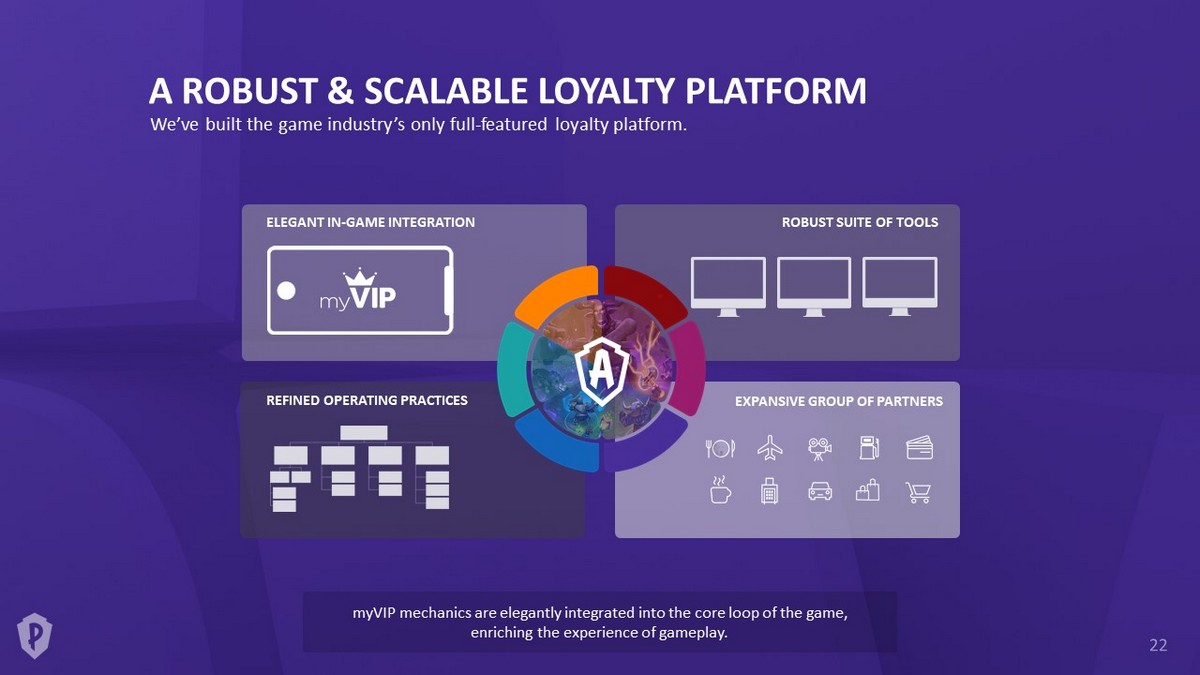
A ROBUST & SCALABLE LOYALTY PLATFORM We’ve built the game industry’s only full - featured loyalty platform. ELEGANT IN - GAME INTEGRATION ROBUST SUITE OF TOOLS REFINED OPERATING PRACTICES EXPANSIVE GROUP OF PARTNERS myVIP mechanics are elegantly integrated into the core loop of the game, enriching the experience of gameplay.
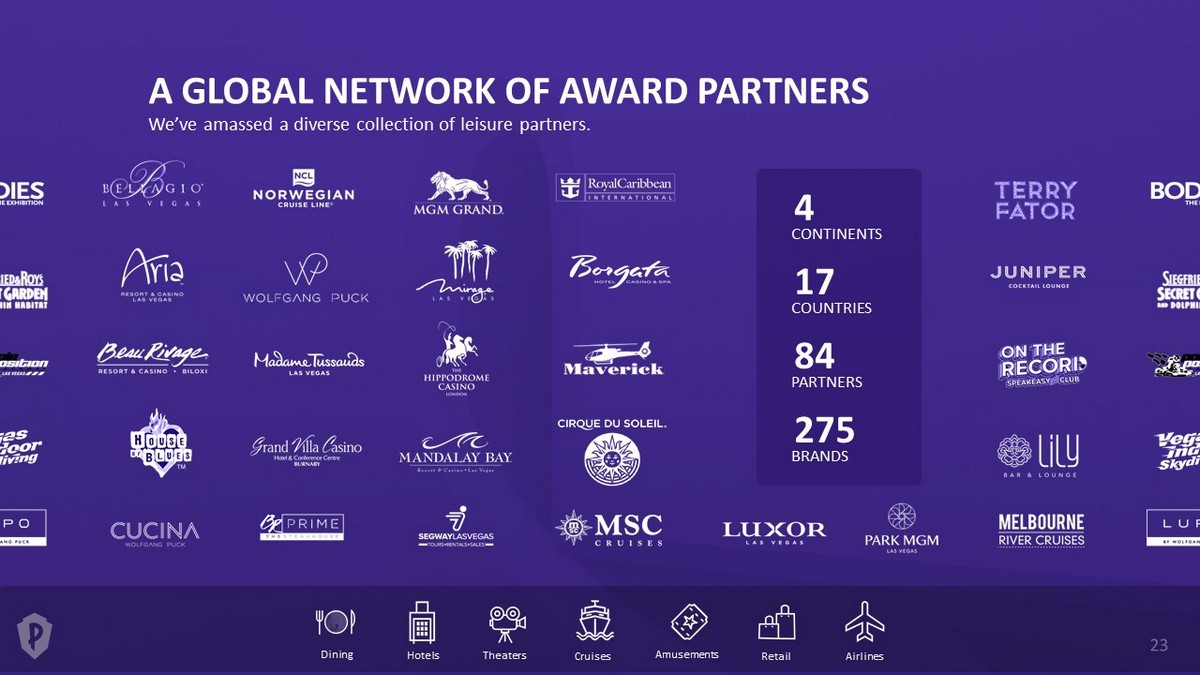
A GLOBAL NETWORK OF AWARD PARTNERS We’ve amassed a diverse collection of leisure partners. CONTINENTS 4 COUNTRIES 17 PARTNERS 84 BRANDS 275 Dining Theaters Airlines Retail Cruises Hotels Amusements
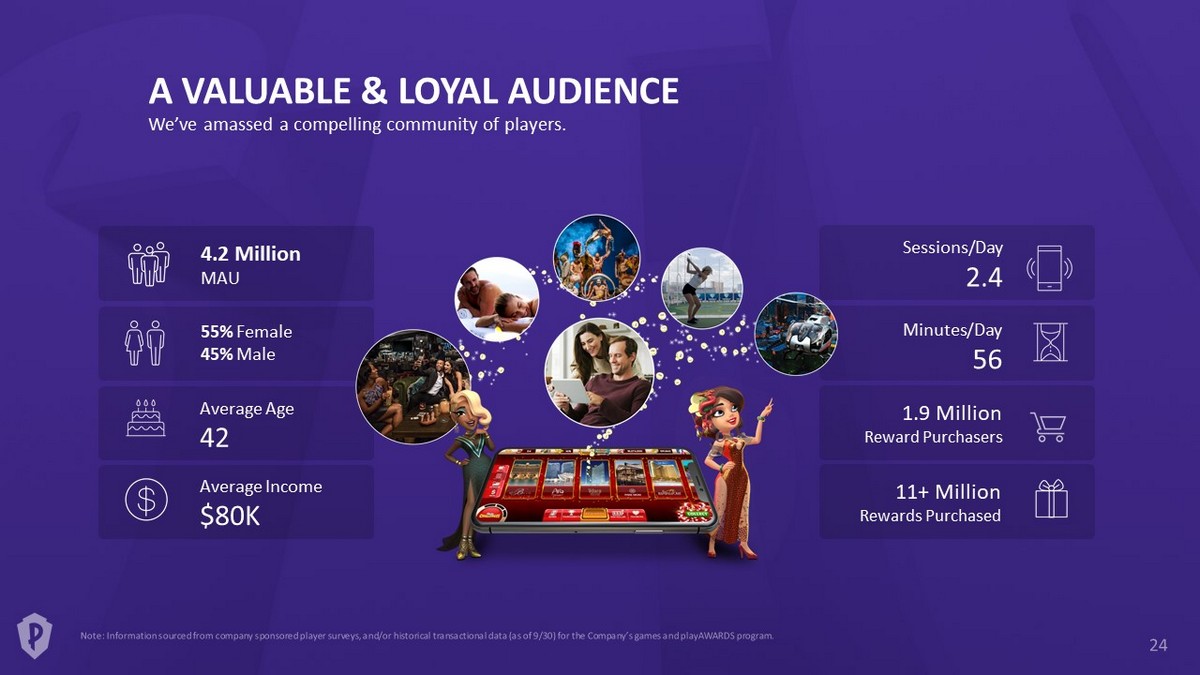
A VALUABLE & LOYAL AUDIENCE We’ve amassed a compelling community of players. 55% Female 45% Male Average Income $80K Average Age 42 4.2 Million MAU Minutes/Day 56 1.9 Million Reward Purchasers Sessions/Day 2.4 11+ Million Rewards Purchased
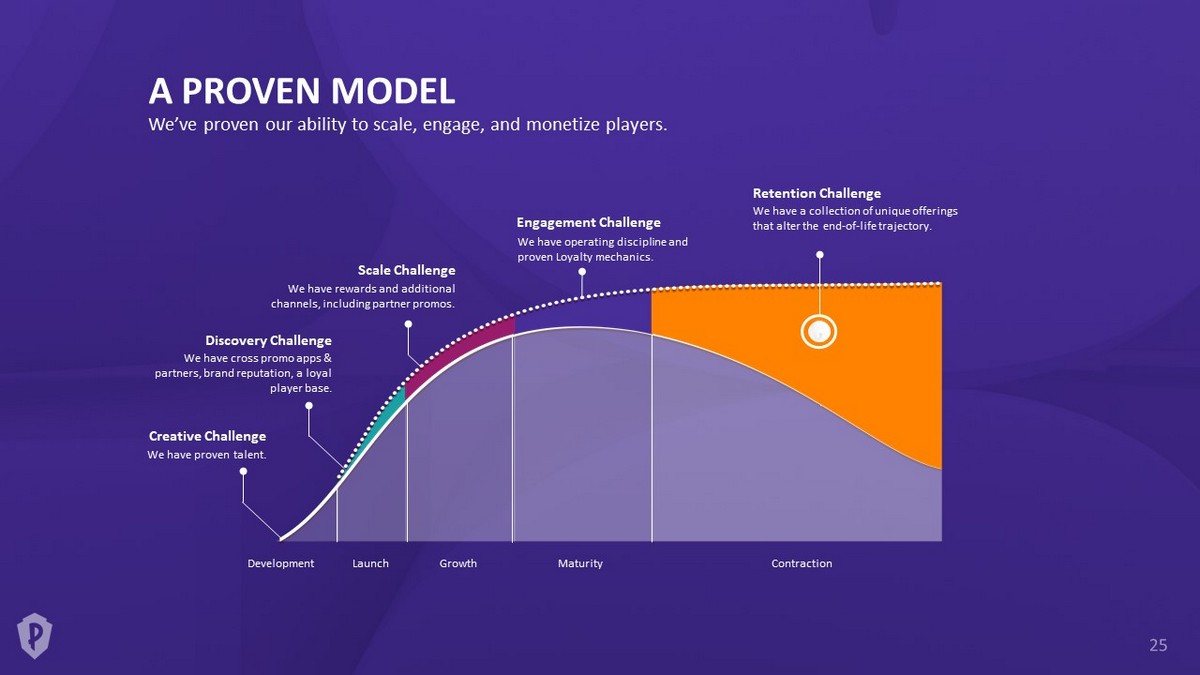
A PROVEN MODEL We’ve proven our ability to scale, engage, and monetize players. Creative Challenge We have proven talent. Discovery Challenge We have cross promo apps & partners, brand reputation, a loyal player base. Development Launch Growth Maturity Contraction Scale Challenge We have rewards and additional channels, including partner promos. Engagement Challenge We have operating discipline and proven Loyalty mechanics. Retention Challenge We have a collection of unique offerings that alter the end - of - life trajectory.
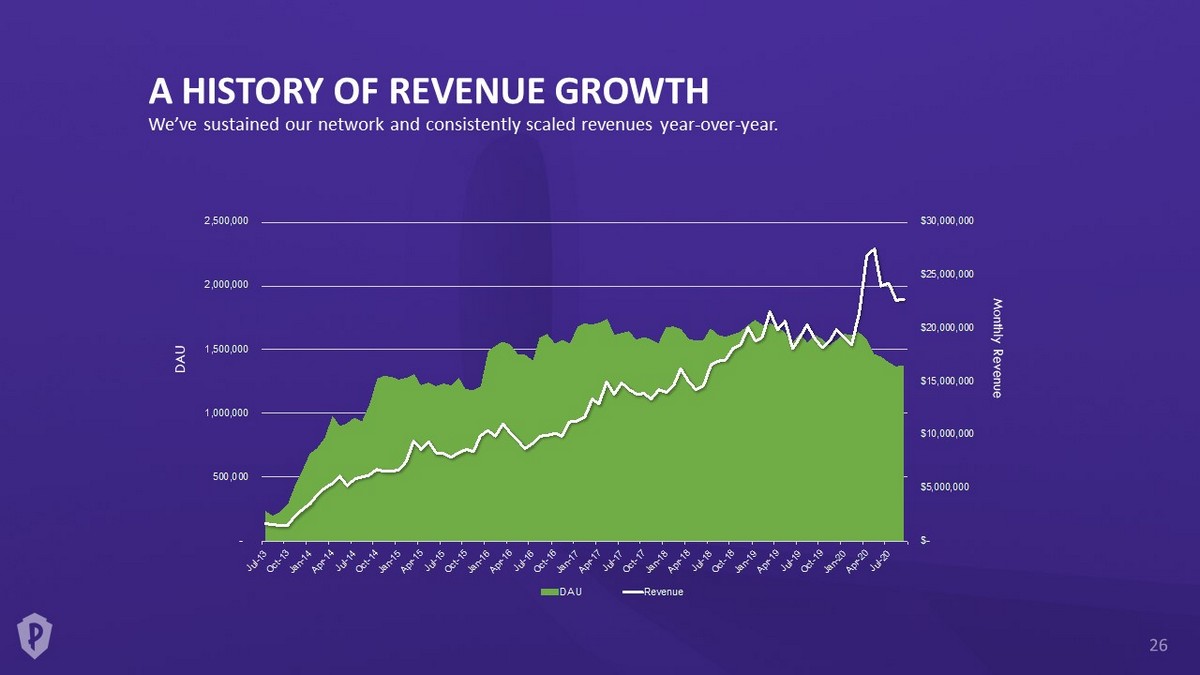
$- $5,000,000 $10,000,000 $15,000,000 $20,000,000 $25,000,000 $30,000,000 - 500,000 1,000,000 1,500,000 2,000,000 2,500,000 J u l - 1 3 O c t - 1 3 J a n - 1 4 A p r - 1 4 J u l - 1 4 O c t - 1 4 J a n - 1 5 A p r - 1 5 J u l - 1 5 O c t - 1 5 J a n - 1 6 A p r - 1 6 J u l - 1 6 O c t - 1 6 J a n - 1 7 A p r - 1 7 J u l - 1 7 O c t - 1 7 J a n - 1 8 A p r - 1 8 J u l - 1 8 O c t - 1 8 J a n - 1 9 A p r - 1 9 J u l - 1 9 O c t - 1 9 J a n - 2 0 A p r - 2 0 J u l - 2 0 DAU Revenue A HISTORY OF REVENUE GROWTH We’ve sustained our network and consistently scaled revenues year - over - year. DAU Monthly Revenue
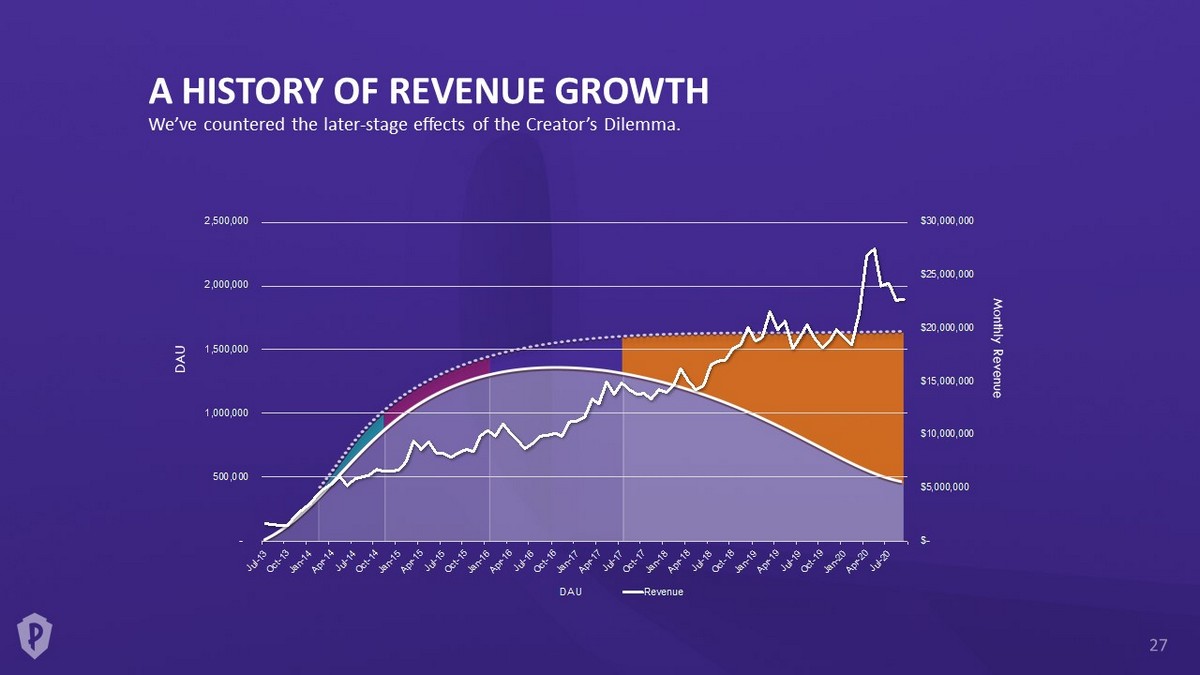
A HISTORY OF REVENUE GROWTH We’ve countered the later - stage effects of the Creator’s Dilemma. DAU Monthly Revenue $- $5,000,000 $10,000,000 $15,000,000 $20,000,000 $25,000,000 $30,000,000 - 500,000 1,000,000 1,500,000 2,000,000 2,500,000 J u l - 1 3 O c t - 1 3 J a n - 1 4 A p r - 1 4 J u l - 1 4 O c t - 1 4 J a n - 1 5 A p r - 1 5 J u l - 1 5 O c t - 1 5 J a n - 1 6 A p r - 1 6 J u l - 1 6 O c t - 1 6 J a n - 1 7 A p r - 1 7 J u l - 1 7 O c t - 1 7 J a n - 1 8 A p r - 1 8 J u l - 1 8 O c t - 1 8 J a n - 1 9 A p r - 1 9 J u l - 1 9 O c t - 1 9 J a n - 2 0 A p r - 2 0 J u l - 2 0 DAU Revenue
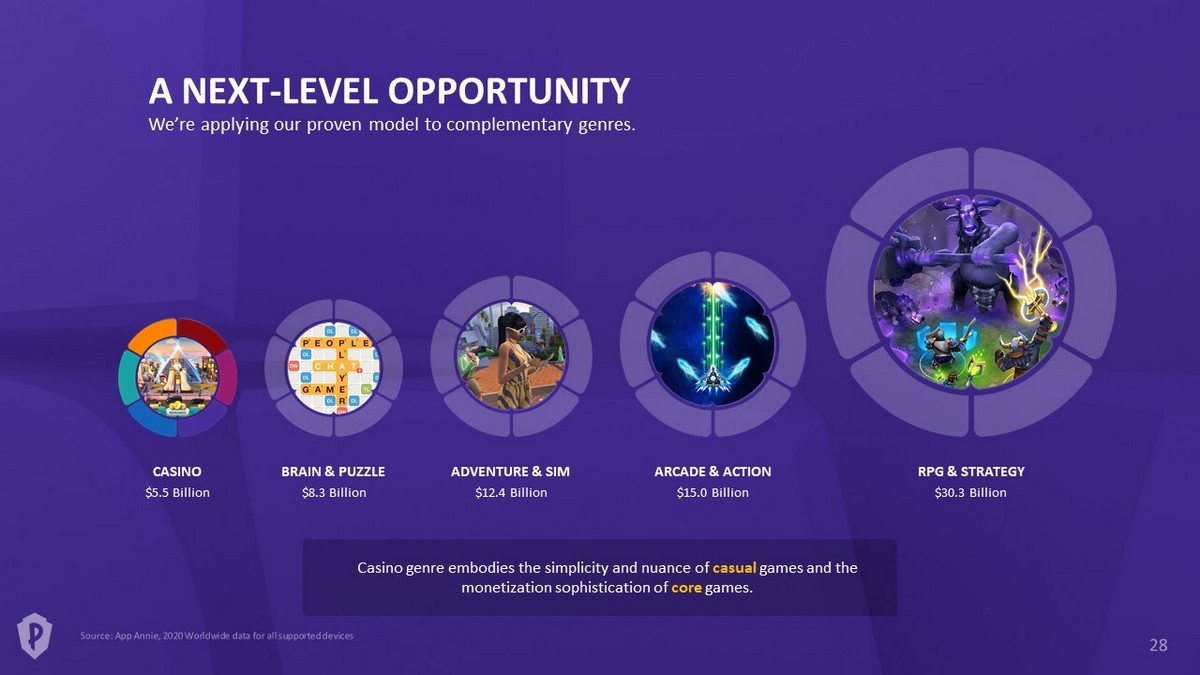
$5.5 Billion CASINO $30.3 Billion RPG & STRATEGY $8.3 Billion BRAIN & PUZZLE $15.0 Billion ARCADE & ACTION $12.4 Billion ADVENTURE & SIM A NEXT - LEVEL OPPORTUNITY We’re applying our proven model to complementary genres. Casino genre embodies the simplicity and nuance of casual games and the monetization sophistication of core games.

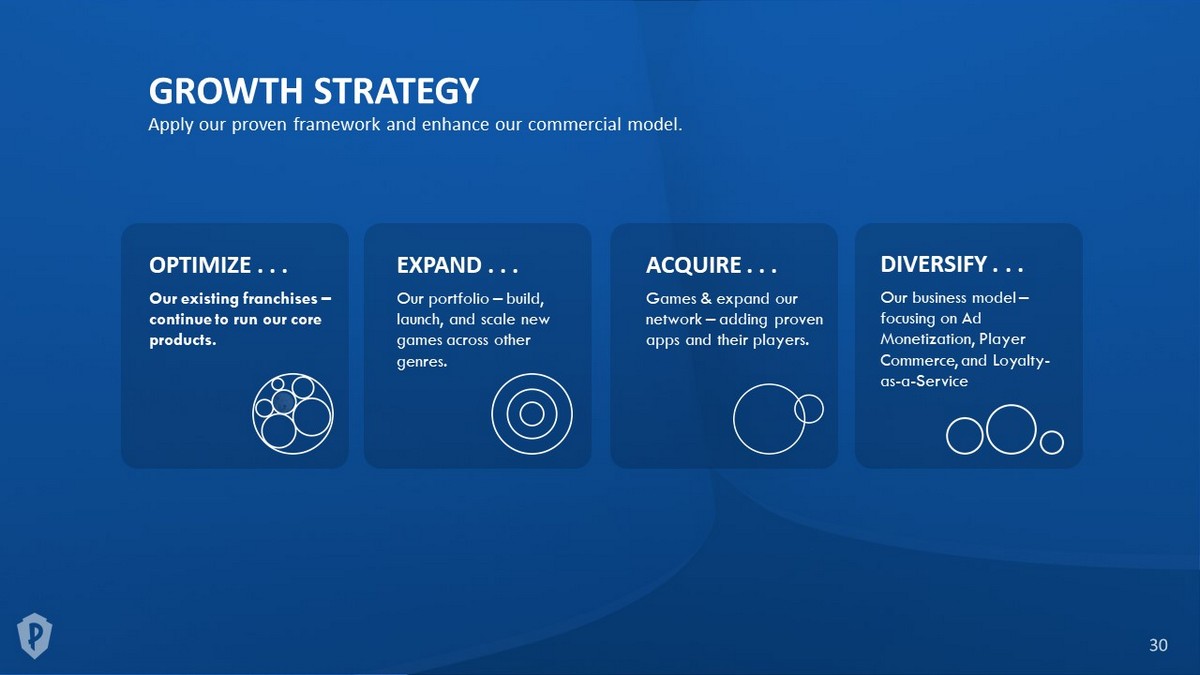
GROWTH STRATEGY Apply our proven framework and enhance our commercial model. OPTIMIZE . . . Our existing franchises – continue to run our core products. EXPAND . . . Our portfolio – build, launch, and scale new games across other genres. ACQUIRE . . . Games & expand our network – adding proven apps and their players. DIVERSIFY . . . Our business model – focusing on Ad Monetization, Player Commerce, and Loyalty - as - a - Service
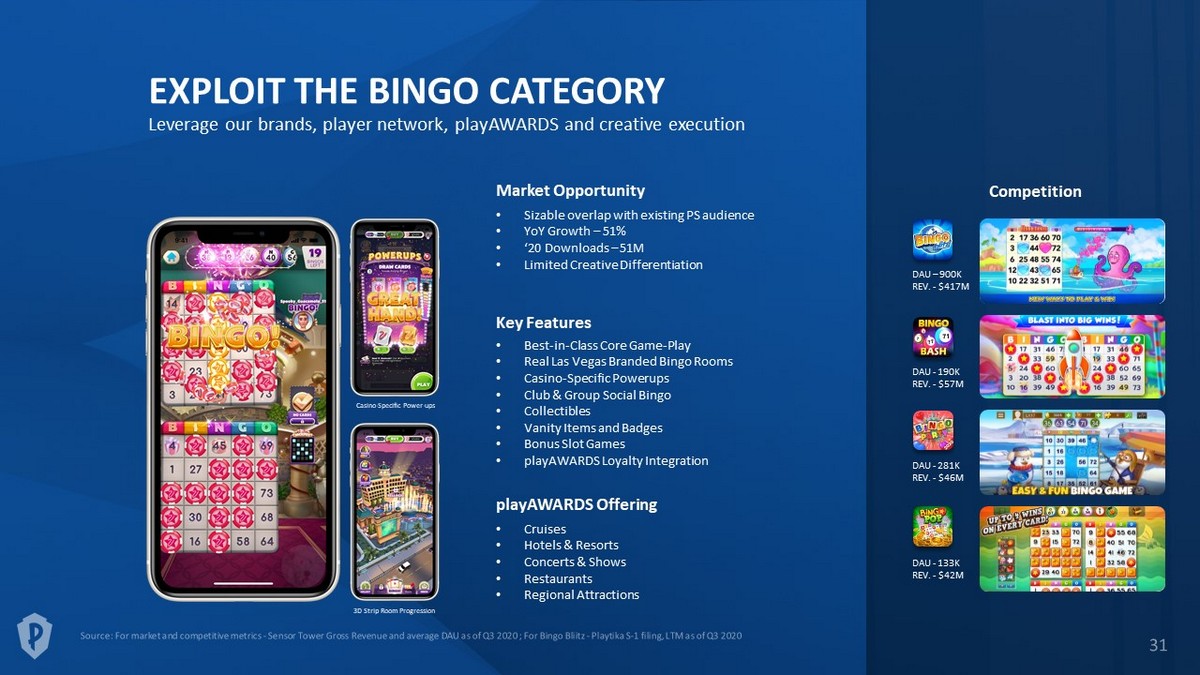
EXPLOIT THE BINGO CATEGORY Leverage our brands, player network, playAWARDS and creative execution Competition • Best - in - Class Core Game - Play • Real Las Vegas Branded Bingo Rooms • Casino - Specific Powerups • Club & Group Social Bingo • Collectibles • Vanity Items and Badges • Bonus Slot Games • playAWARDS Loyalty Integration Key Features Market Opportunity • Sizable overlap with existing PS audience • YoY Growth – 51% • ‘20 Downloads – 51M • Limited Creative Differentiation 3D Strip Room Progression Casino - Specific Power - ups DAU – 900K REV. - $417M DAU - 190K REV. - $57M DAU - 281K REV. - $46M DAU - 133K REV. - $42M playAWARDS Offering • Cruises • Hotels & Resorts • Concerts & Shows • Restaurants • Regional Attractions
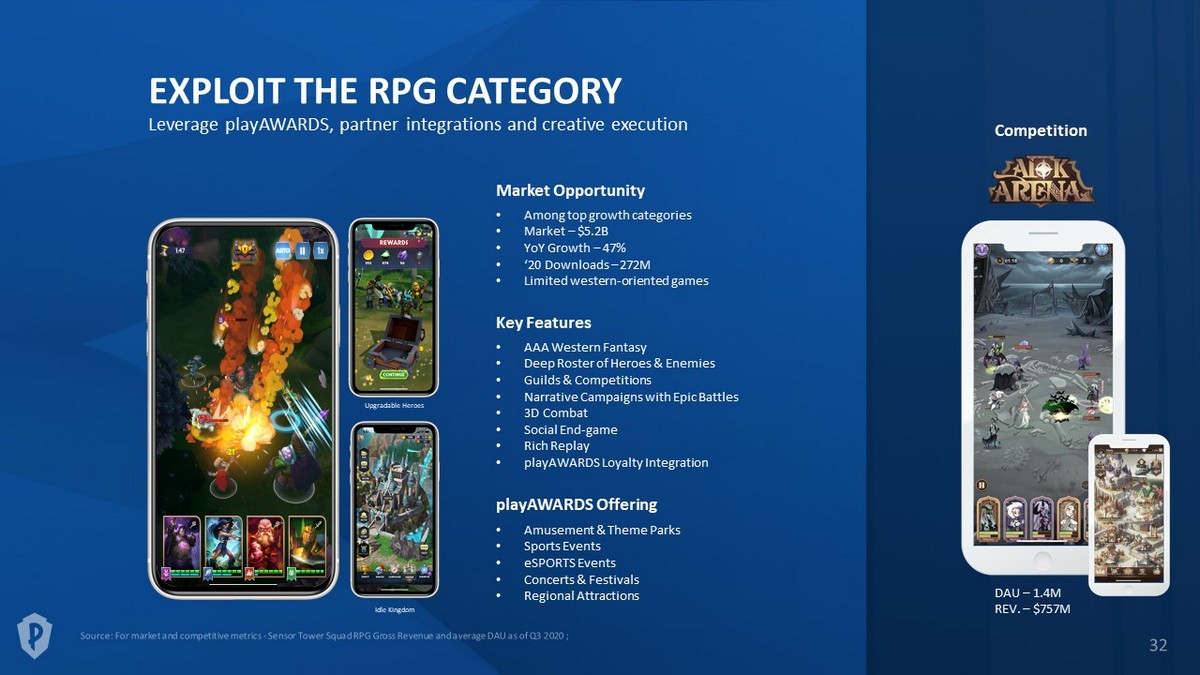
• Among top growth categories • Market – $5.2B • YoY Growth – 47% • ‘20 Downloads – 272M • Limited western - oriented games EXPLOIT THE RPG CATEGORY Leverage playAWARDS , partner integrations and creative execution Competition Idle Kingdom Upgradable Heroes • AAA Western Fantasy • Deep Roster of Heroes & Enemies • Guilds & Competitions • Narrative Campaigns with Epic Battles • 3D Combat • Social End - game • Rich Replay • playAWARDS Loyalty Integration Key Features Market Opportunity DAU – 1.4M REV. – $757M playAWARDS Offering • Amusement & Theme Parks • Sports Events • eSPORTS Events • Concerts & Festivals • Regional Attractions
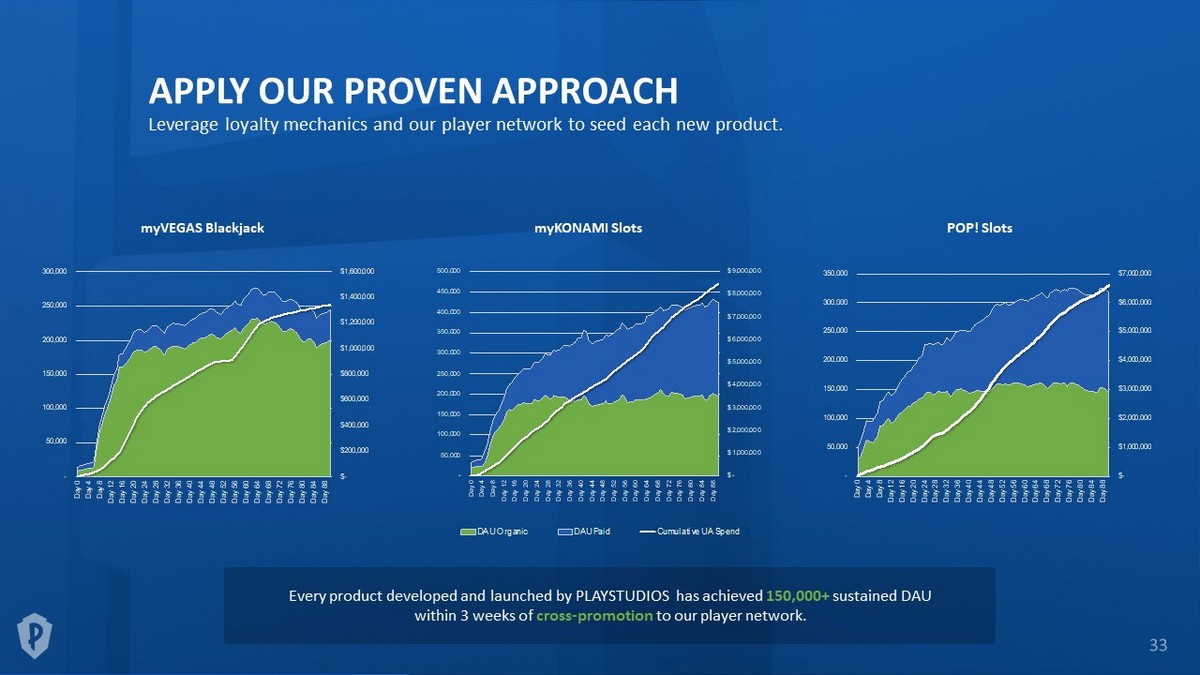
$- $1,000,000 $2,000,000 $3,000,000 $4,000,000 $5,000,000 $6,000,000 $7,000,000 - 50,000 100,000 150,000 200,000 250,000 300,000 350,000 D a y 0 D a y 4 D a y 8 D a y 1 2 D a y 1 6 D a y 2 0 D a y 2 4 D a y 2 8 D a y 3 2 D a y 3 6 D a y 4 0 D a y 4 4 D a y 4 8 D a y 5 2 D a y 5 6 D a y 6 0 D a y 6 4 D a y 6 8 D a y 7 2 D a y 7 6 D a y 8 0 D a y 8 4 D a y 8 8 $- $1,000,000 $2,000,000 $3,000,000 $4,000,000 $5,000,000 $6,000,000 $7,000,000 $8,000,000 $9,000,000 - 50,000 100,000 150,000 200,000 250,000 300,000 350,000 400,000 450,000 500,000 D a y 0 D a y 4 D a y 8 D a y 1 2 D a y 1 6 D a y 2 0 D a y 2 4 D a y 2 8 D a y 3 2 D a y 3 6 D a y 4 0 D a y 4 4 D a y 4 8 D a y 5 2 D a y 5 6 D a y 6 0 D a y 6 4 D a y 6 8 D a y 7 2 D a y 7 6 D a y 8 0 D a y 8 4 D a y 8 8 DAU Organic DAU Paid Cumulative UA Spend $- $200,000 $400,000 $600,000 $800,000 $1,000,000 $1,200,000 $1,400,000 $1,600,000 - 50,000 100,000 150,000 200,000 250,000 300,000 D a y 0 D a y 4 D a y 8 D a y 1 2 D a y 1 6 D a y 2 0 D a y 2 4 D a y 2 8 D a y 3 2 D a y 3 6 D a y 4 0 D a y 4 4 D a y 4 8 D a y 5 2 D a y 5 6 D a y 6 0 D a y 6 4 D a y 6 8 D a y 7 2 D a y 7 6 D a y 8 0 D a y 8 4 D a y 8 8 APPLY OUR PROVEN APPROACH Leverage loyalty mechanics and our player network to seed each new product. myVEGAS Blackjack myKONAMI Slots POP! Slots Every product developed and launched by PLAYSTUDIOS has achieved 150,000+ sustained DAU within 3 weeks of cross - promotion to our player network.
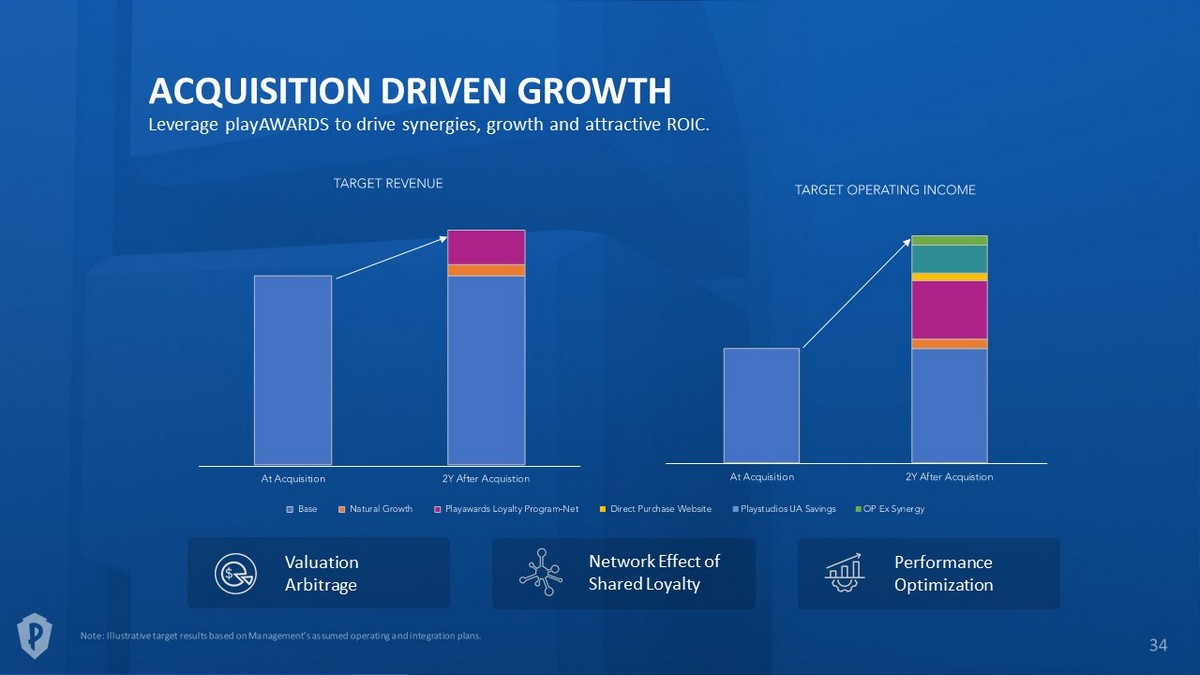
ACQUISITION DRIVEN GROWTH Leverage playAWARDS to drive synergies, growth and attractive ROIC. Network Effect of Shared Loyalty Performance Optimization Valuation Arbitrage
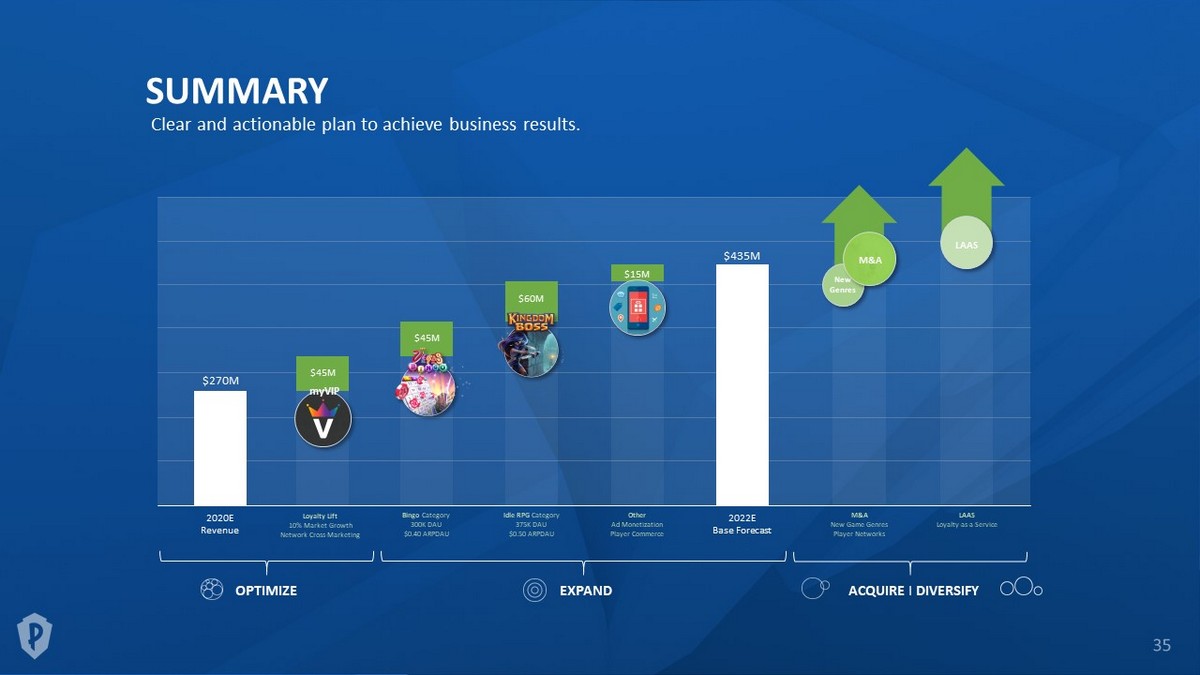
SUMMARY Clear and actionable plan to achieve business results. Loyalty Lift 10% Market Growth Network Cross - Marketing Bingo Category 300K DAU $0.40 ARPDAU Idle RPG Category 375K DAU $0.50 ARPDAU $270M $435M 2020E Revenue 2022E Base Forecast M&A New Game Genres Player Networks $45M $45M $60M EXPAND OPTIMIZE Other Ad Monetization Player Commerce $15M ACQUIRE I DIVERSIFY myVIP New Genres LAAS M&A LAAS Loyalty - as - a - Service

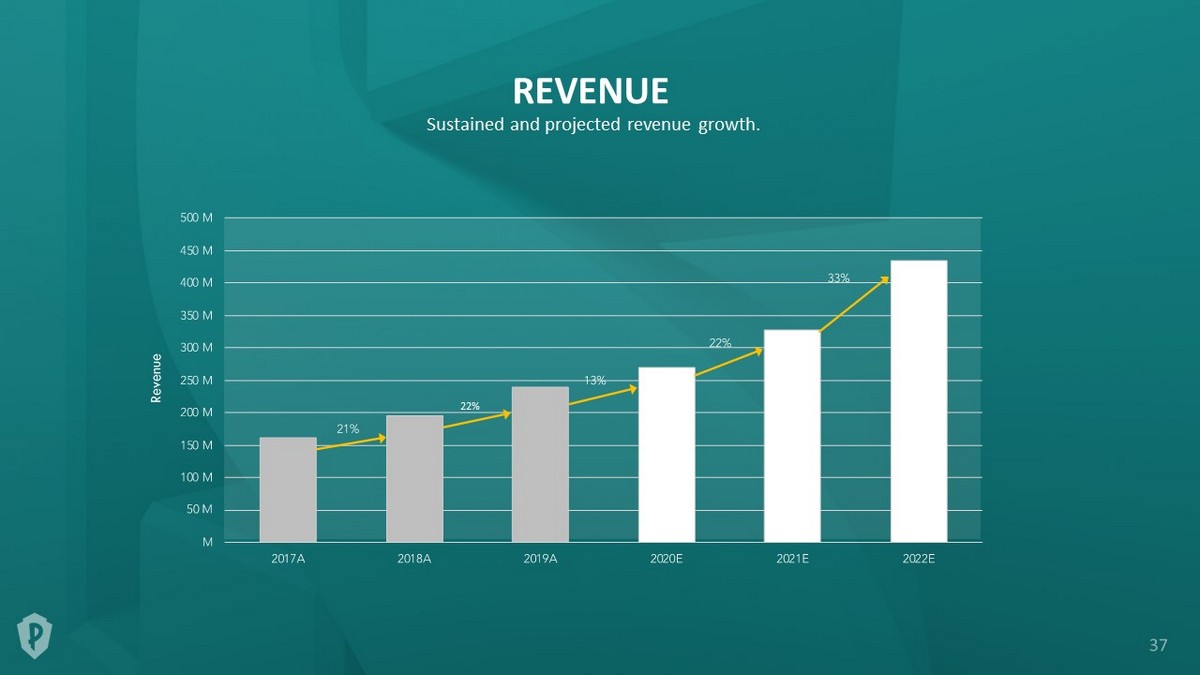
22% Revenue REVENUE Sustained and projected revenue growth.
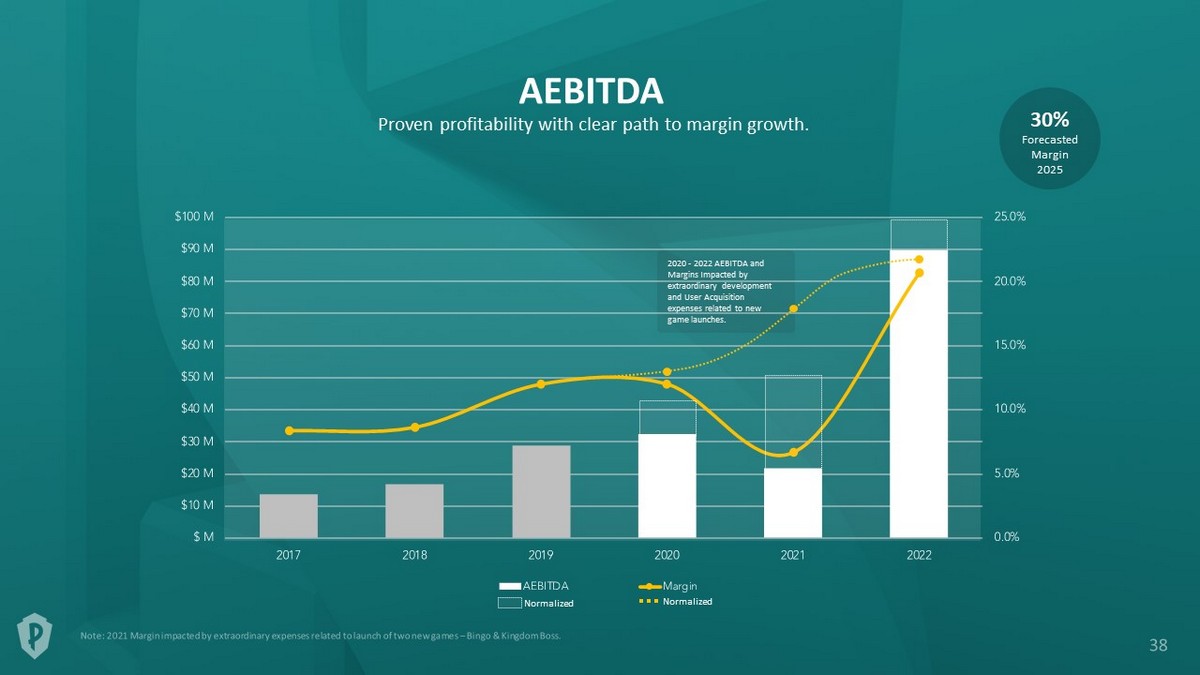
2020 - 2022 AEBITDA and Margins Impacted by extraordinary development and User Acquisition expenses related to new game launches. AEBITDA Proven profitability with clear path to margin growth. Forecasted Margin 2025 30% Normalized Normalized
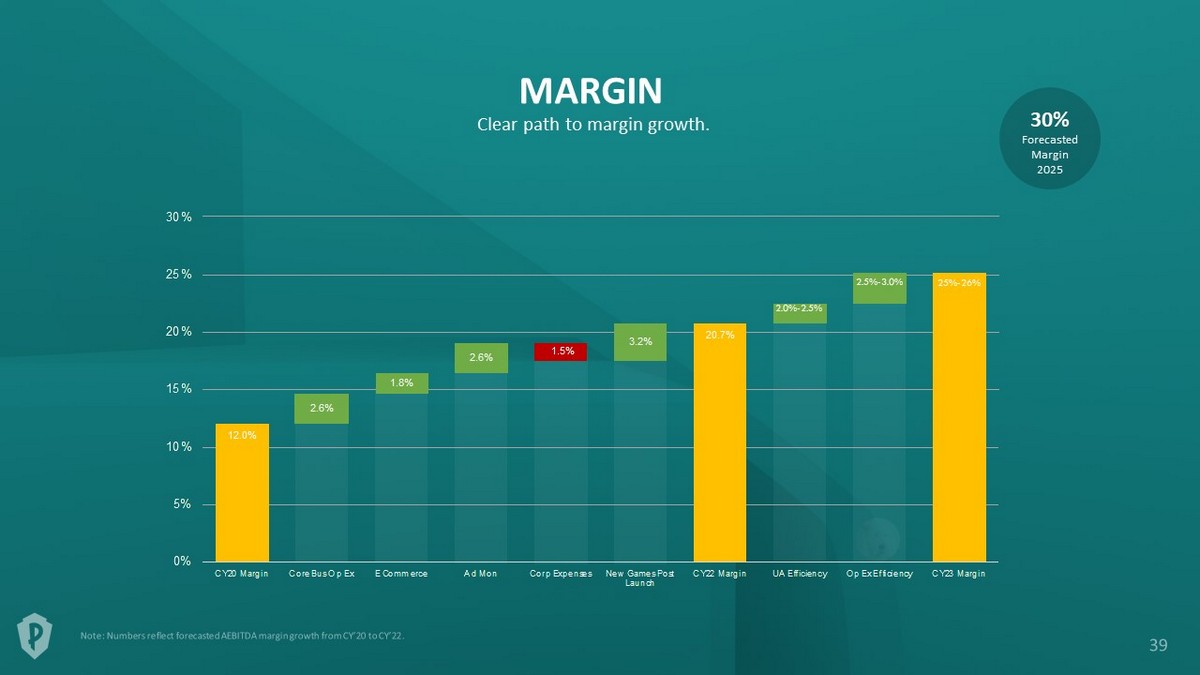
MARGIN Clear path to margin growth. 12.0% 20.7% 2.6% 1.8% 2.6% 1.5% 3.2% 0% 5% 10% 15% 20% 25% 30% CY20 Margin Core Bus Op Ex E Commerce Ad Mon Corp Expenses New Games Post Launch CY22 Margin UA Efficiency Op Ex Efficiency CY23 Margin 2.0% - 2.5% 2.5% - 3.0% 25% - 26% Forecasted Margin 2025 30%
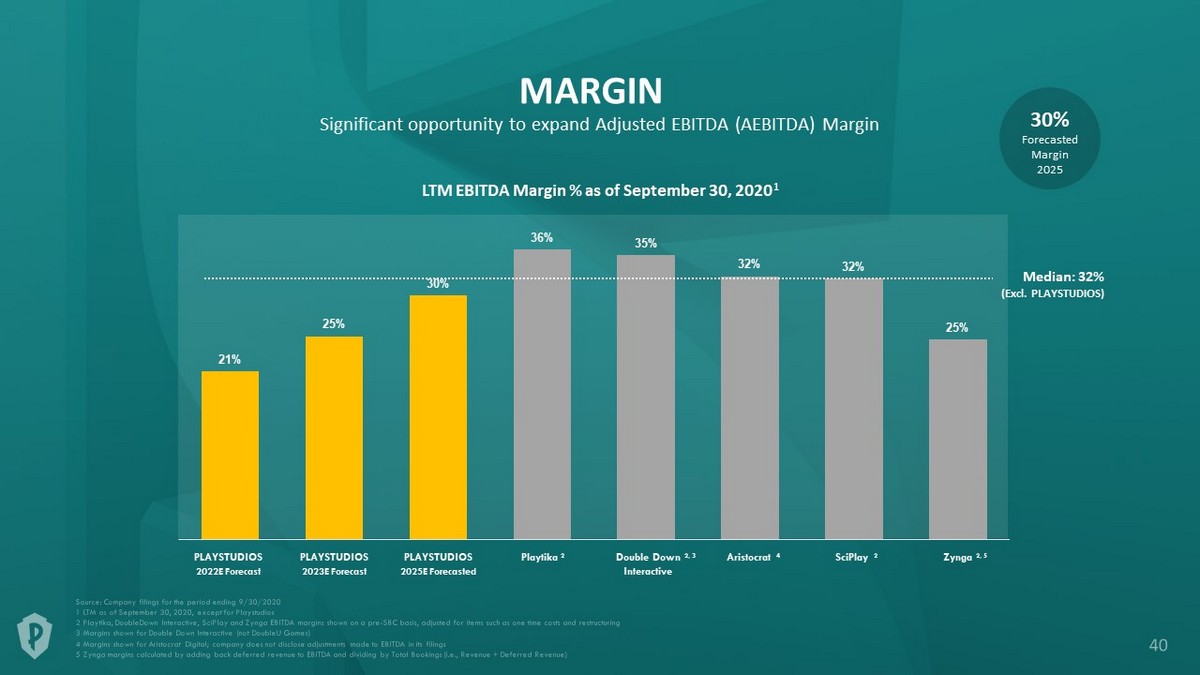
MARGIN 21% 25% 30% 36% 35% 32% 32% 25% LTM EBITDA Margin % as of September 30, 2020 1 Median: 32% (Excl. PLAYSTUDIOS) Playtika 4 2, 3 2025E Forecasted 2 2 2, 5 PLAYSTUDIOS PLAYSTUDIOS Double Down Interactive Aristocrat SciPlay Zynga 2022E Forecast PLAYSTUDIOS 2023E Forecast Significant opportunity to expand Adjusted EBITDA (AEBITDA) Margin Forecasted Margin 2025 30%
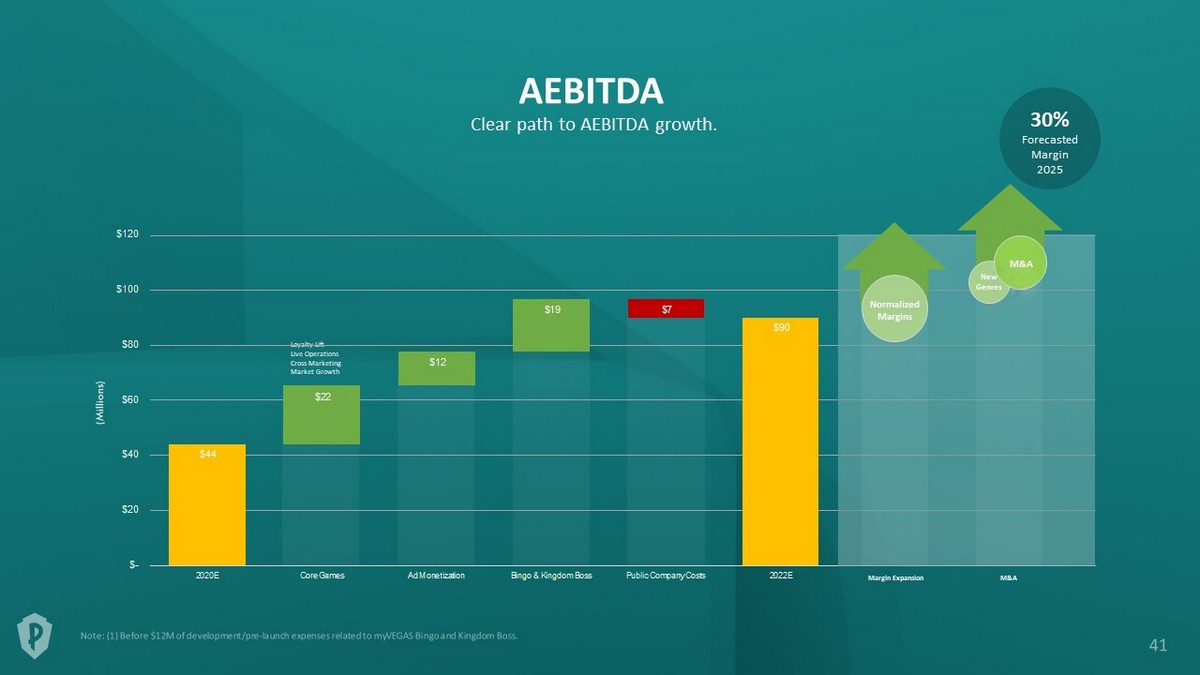
AEBITDA Clear path to AEBITDA growth. Forecasted Margin 2025 30% (1) Loyalty Lift Live Operations Cross - Marketing Market Growth (Millions) $44 $90 $22 $12 $19 $7 $- $20 $40 $60 $80 $100 $120 2020E Core Games Ad Monetization Bingo & Kingdom Boss Public Company Costs 2022E Margin Expansion M&A Normalized Margins New Genres M&A
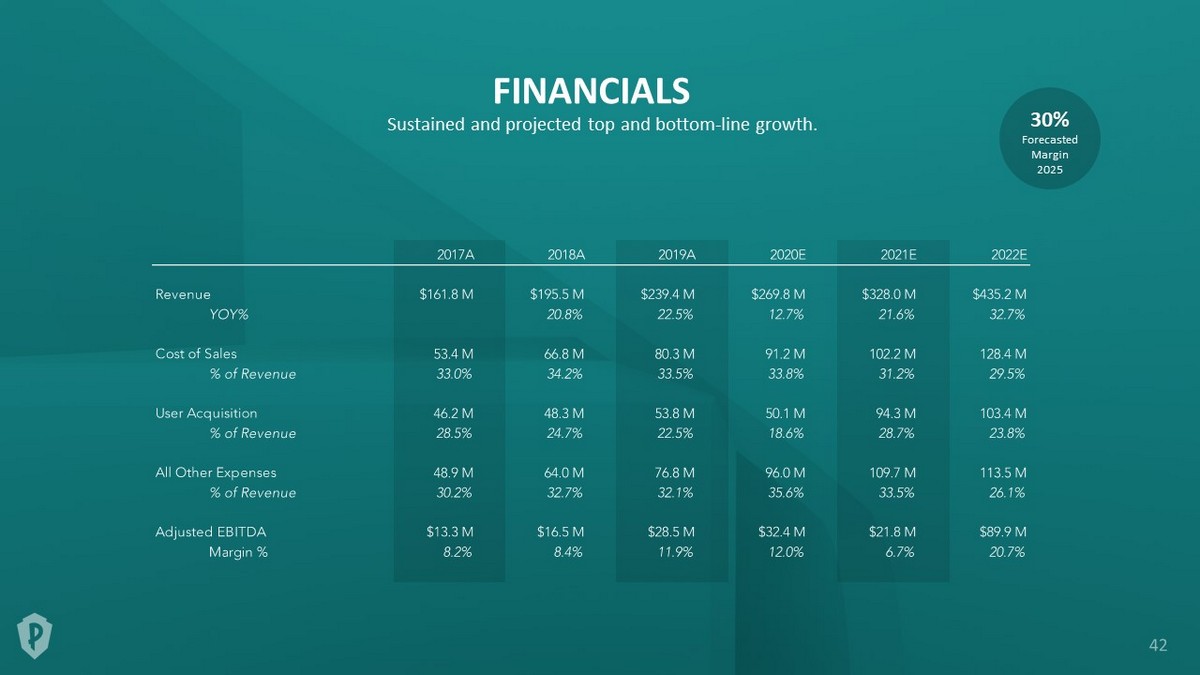
FINANCIALS Sustained and projected top and bottom - line growth. Forecasted Margin 2025 30%

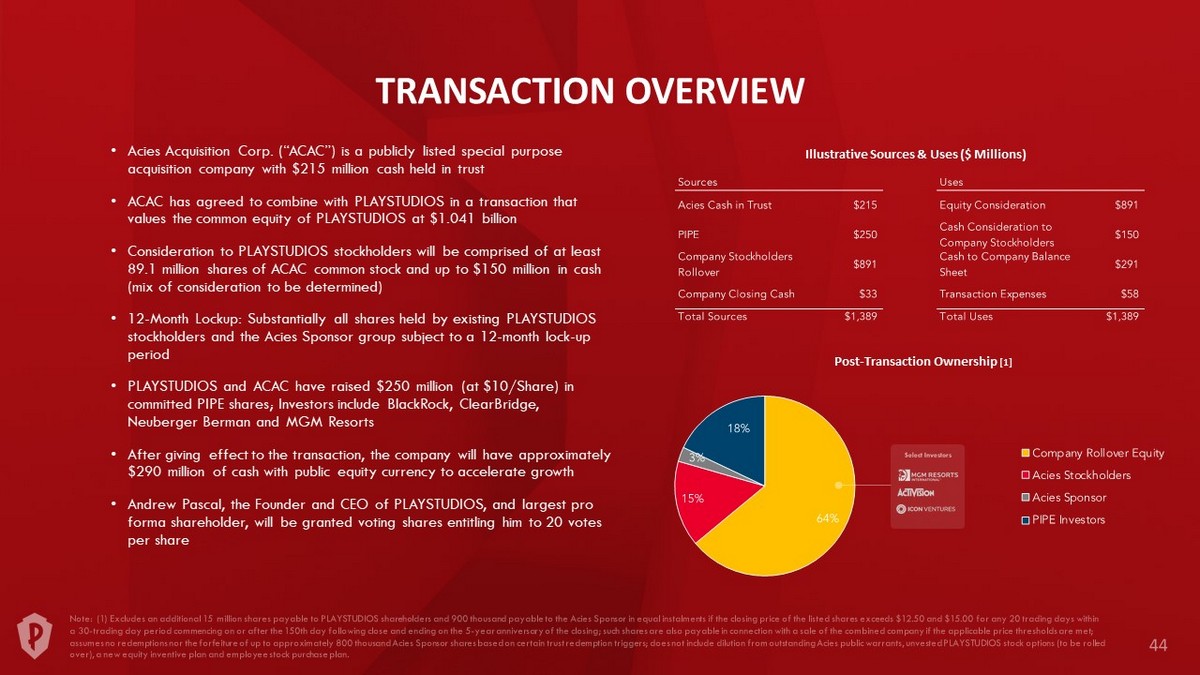
TRANSACTION OVERVIEW Illustrative Sources & Uses ($ Millions) Post - Transaction Ownership [1] • Acies Acquisition Corp. (“ACAC”) is a publicly listed special purpose acquisition company with $215 million cash held in trust • ACAC has agreed to combine with PLAYSTUDIOS in a transaction that values the common equity of PLAYSTUDIOS at $1.041 billion • Consideration to PLAYSTUDIOS stockholders will be comprised of at least 89.1 million shares of ACAC common stock and up to $150 million in cash (mix of consideration to be determined) • 12 - Month Lockup: Substantially all shares held by existing PLAYSTUDIOS stockholders and the Acies Sponsor group subject to a 12 - month lock - up period • PLAYSTUDIOS and ACAC have raised $250 million (at $10/Share) in committed PIPE shares; Investors include BlackRock, ClearBridge , Neuberger Berman and MGM Resorts • After giving effect to the transaction, the company will have approximately $290 million of cash with public equity currency to accelerate growth • Andrew Pascal, the Founder and CEO of PLAYSTUDIOS, and largest pro forma shareholder, will be granted voting shares entitling him to 20 votes per share
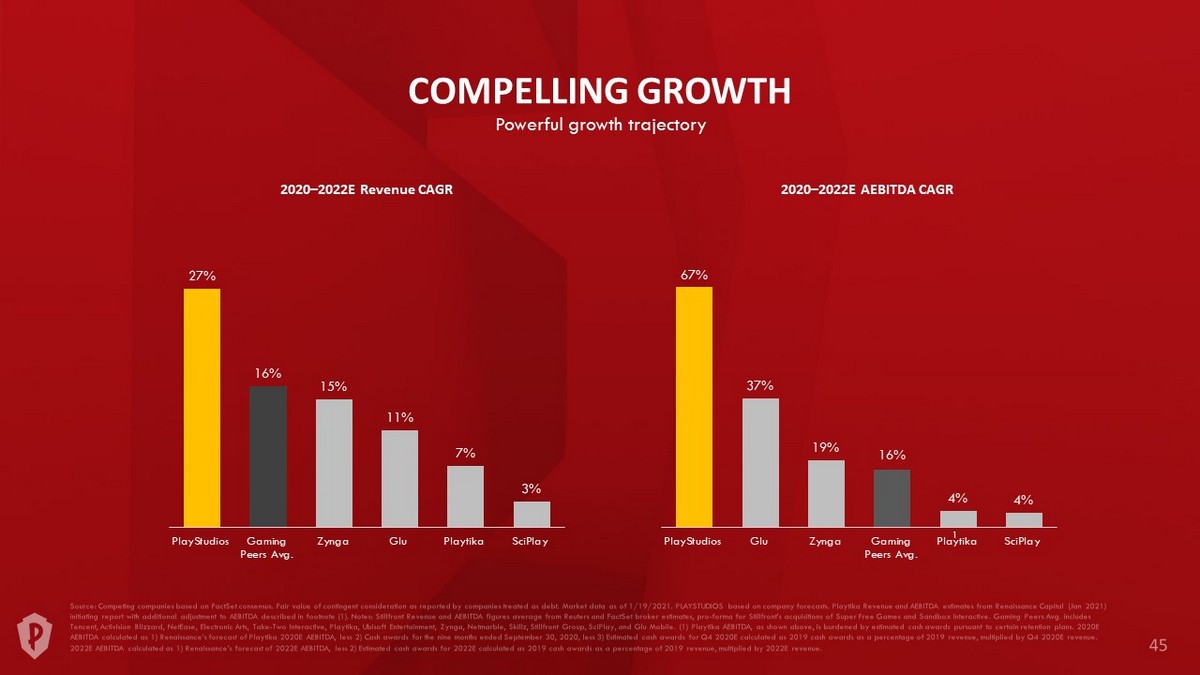
67% 37% 19% 16% 4% 4% PlayStudios Glu Zynga Gaming Peers Avg. Playtika SciPlay 2020 – 2022E Revenue CAGR 2020 – 2022E AEBITDA CAGR 1 27% 16% 15% 11% 7% 3% PlayStudios Gaming Peers Avg. Zynga Glu Playtika SciPlay COMPELLING GROWTH Powerful growth trajectory
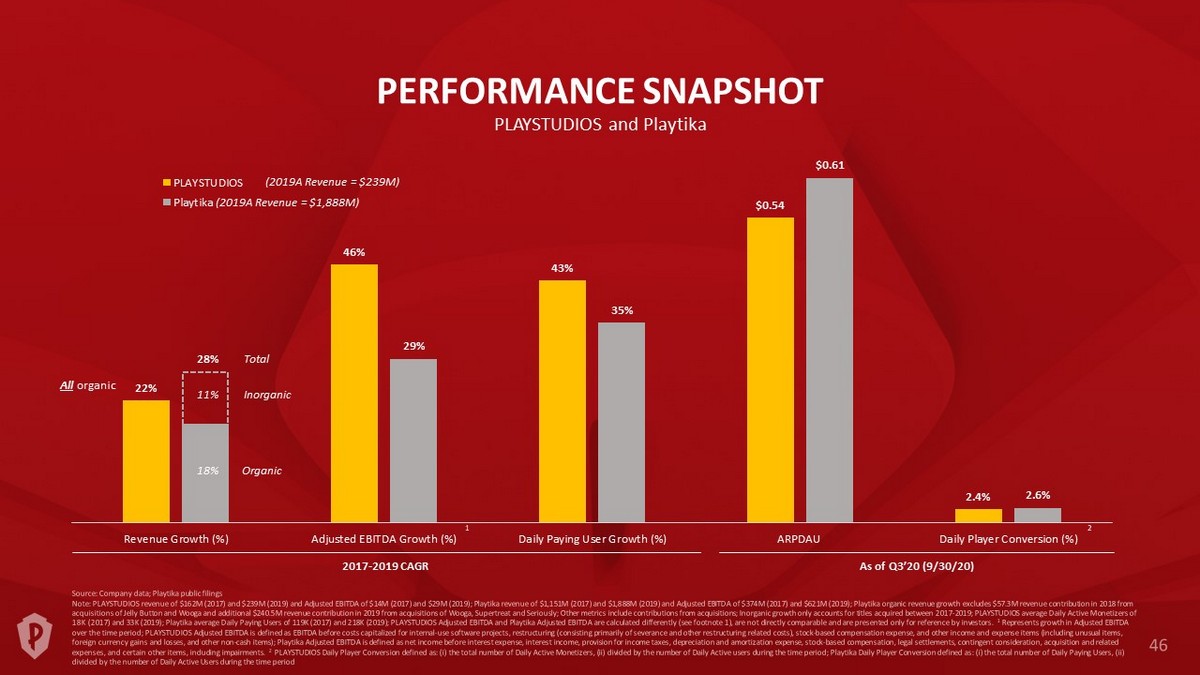
22% 46% 43% $0.54 2.4% 29% 35% $0.61 2.6% Revenue Growth (%) Adjusted EBITDA Growth (%) Daily Paying User Growth (%) ARPDAU Daily Player Conversion (%) PLAYSTUDIOS Playtika 28% 11% 2017 - 2019 CAGR 2 As of Q3’20 (9/30/20) 1 Organic Total Inorganic (2019A Revenue = $239M) All organic 18% PERFORMANCE SNAPSHOT (2019A Revenue = $1,888M) PLAYSTUDIOS and Playtika
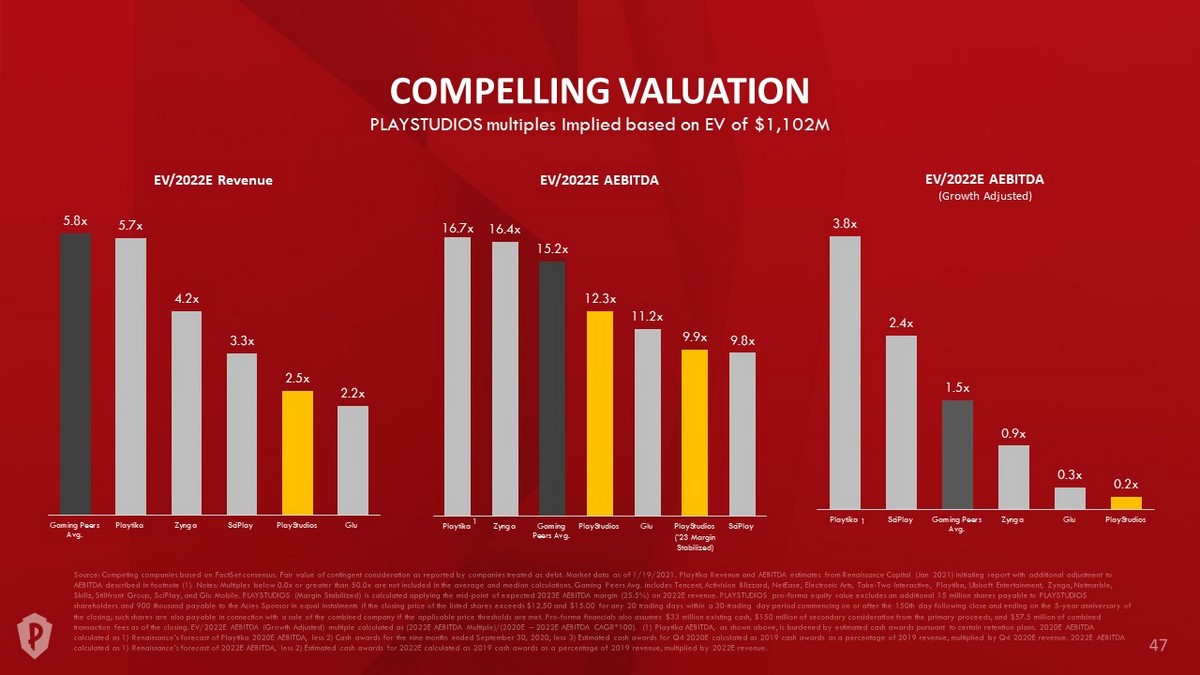
3.8x 2.4x 1.5x 0.9x 0.3x 0.2x Playtika SciPlay Gaming Peers Avg. Zynga Glu PlayStudios COMPELLING VALUATION (’23 Margin Stabilized) PLAYSTUDIOS multiples Implied based on EV of $1,102M EV/2022E Revenue EV/2022E AEBITDA EV/2022E AEBITDA (Growth Adjusted) 5.8x 5.7x 4.2x 3.3x 2.5x 2.2x Gaming Peers Avg. Playtika Zynga SciPlay PlayStudios Glu 16.7x 16.4x 15.2x 12.3x 11.2x 9.9x 9.8x Playtika Zynga Gaming Peers Avg. PlayStudios Glu PlayStudios SciPlay 1 1
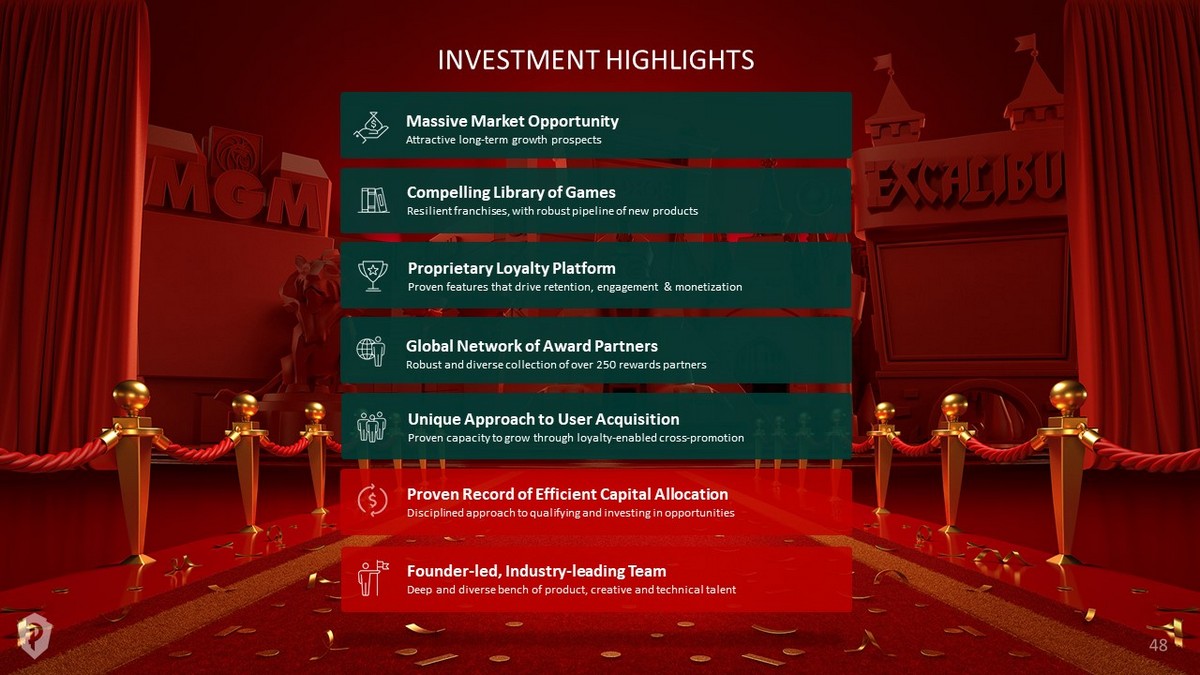
Massive Market Opportunity Attractive long - term growth prospects Proven Record of Efficient Capital Allocation Disciplined approach to qualifying and investing in opportunities Compelling Library of Games Resilient franchises, with robust pipeline of new products Unique Approach to User Acquisition Proven capacity to grow through loyalty - enabled cross - promotion Global Network of Award Partners Robust and diverse collection of over 250 rewards partners Proprietary Loyalty Platform Proven features that drive retention, engagement & monetization Founder - led, Industry - leading Team Deep and diverse bench of product, creative and technical talent INVESTMENT HIGHLIGHTS