
IT’S MORE THAN A GAME.
DISCLAIMER Forward Looking Statements This presentation contains “forward-looking statements” within the meaning of the Private Securities Litigation Reform Act of 1995, including statements regarding our future financial and operating performance, our liquidity and capital resources, the development and release plans of our games, and our mergers and acquisition strategy, all of which involve risks and uncertainties. Actual results may differ materially from the results predicted and reported results should not be considered as an indication of future performance. Forward-looking statements include all statements that are not historical facts and can be identified by terms such as “may,” “might,” “will,” “should,” “expects,” “plans,” “anticipates,” “intends,” “believes,” “estimates,” “predicts,” “potential” or “continue,” the negative of these terms and other comparable terminology that conveys uncertainty of future events or outcomes. These forward-looking statements involve known and unknown risks, uncertainties, assumptions and other factors that may cause actual results to differ materially from statements made in this press release, including our ability to develop and publish our games; risks related to defects, errors, or vulnerabilities in our games and IT infrastructure; our ability to attract new, and retain existing, players of our games; the failure to timely develop and achieve market acceptance of new games and maintain the popularity of our existing games; rapidly evolving technological developments in the gaming market; competition in the industry in which we operate; our financial performance; our ability to execute merger and acquisition transactions; legal and regulatory developments; and general market, political, economic and business conditions. Other potential risks and uncertainties that could cause actual results to differ from the results predicted include, among others, those risks and uncertainties included under the captions “Risk Factors” and “Management’s Discussion and Analysis of Financial Condition and Results of Operations” in our registration statement on Form S-1 filed with the Securities and Exchange Commission (the “SEC”) on July 28, 2021 and in other filings we make with the SEC from time to time, including our Annual Report on Form 10-K for the year ended December 31, 2021, to be filed with the SEC. All information provided in this presentation is based on information available to us as of the date of this presentation and any forward-looking statements contained herein are based on assumptions that we believe are reasonable as of this date. Undue reliance should not be placed on the forward-looking statements in this presentation, which are inherently uncertain. We undertake no duty to update this information unless required by law. Non-GAAP Financial Measures To provide investors with information in addition to results as determined by GAAP, the Company discloses Adjusted Earnings Before Interest Taxes Depreciation and Amortization (“AEBITDA”) as a non-GAAP measure that management believes provides useful information to investors. This measure is not a financial measure calculated in accordance with GAAP and should not be considered as a substitute for revenue, net income or any other operating performance measure calculated in accordance with GAAP. We define AEBITDA as net income (loss) before interest, income taxes, depreciation and amortization, restructuring and related costs (consisting primarily of severance and other restructuring related costs), stock-based compensation expense, and other income and expense items (including special infrequent items, foreign currency gains and losses, and other non-cash items). We also present AEBITDA margin, a non-GAAP measure, which we calculate as AEBITDA as a percentage of net revenues. We believe that the presentation of AEBITDA provides useful information to investors regarding the Company’s results of operations because the measure assists both investors and management in analyzing and benchmarking the performance and value of our business. AEBITDA provides an indicator of performance that is not affected by fluctuations in certain costs or other items. Accordingly, management believes that this measure is useful for comparing general operating performance from period to period, and management relies on this measure for planning and forecasting of future periods. Additionally, this measure allows management to compare results with those of other companies that have different financing and capital structures. However, other companies may define AEBITDA differently, and as a result, our measure of AEBITDA may not be directly comparable to that of other companies. For further information regarding these non-GAAP measures, including the reconciliation of these non-GAAP financial measures to their most directly comparable GAAP financial measures, please refer to the “Reconciliation of Net Income (Loss) to AEBITDA” section of this presentation. Trademarks This presentation contains trademarks, service marks, trade names and copyrights of Acies, PLAYSTUDIOS and other companies, which are the property of their respective owners.
DISCLAIMER (continued) Key Performance Indicators We manage our business by regularly reviewing several key operating metrics to track historical performance, identify trends in player activity, and set strategic goals for the future. Our key performance metrics are impacted by several factors that could cause them to fluctuate on a quarterly basis, such as platform providers’ policies, seasonality, player connectivity, and the addition of new content to games. We believe these measures are useful to investors for the same reasons. The key performance indicators may differ from similarly titled measures presented by other companies. For more information on our key performance indicators, please refer to the definitions below and the “Supplemental Data—Key Performance Indicators” in our SEC filings. Daily Active Users (“DAU”): DAU is defined as the number of individuals who played a game on a particular day. We track DAU by the player ID, which is assigned for each game installed by an individual. As such, an individual who plays two different games on the same day is counted as two DAU while an individual who plays the same game on two different devices is counted as one DAU. Average DAU is calculated as the average of the DAU for each day during the period presented. We use DAU as a measure of audience engagement to help us understand the size of the active player base engaged with our games on a daily basis. Monthly Active Users (“MAU”): MAU is defined as the number of individuals who played a game in a particular month. As with DAU, an individual who plays two different games in the same month is counted as two MAU while an individual who plays the same game on two different devices is counted as one MAU. Average MAU is calculated as the average of MAU for each calendar month during the period presented. We use MAU as a measure of audience engagement to help us understand the size of the active player base engaged with our games on a monthly basis. Daily Paying Users (“DPU”): DPU is defined as the number of individuals who made a purchase in a mobile game during a particular day. As with DAU and MAU, we track DPU based on account activity. As such, an individual who makes a purchase on two different games in a particular day is counted as two DPU while an individual who makes purchases in the same game on two different devices is counted as one DPU. Average DPU is calculated as the average of the DPU for each day during the period presented. We use DPU to understand the size of our active player base that makes in-game purchases. This focus directs our strategic goals in setting player acquisition and pricing strategy. Daily Payer Conversion: Daily Payer Conversion is defined as DPU as a percentage of DAU on a particular day. Average Daily Payer Conversion is calculated as the average DPU divided by average DAU for a given period. We use Daily Payer Conversion to understand the monetization of our active players. Average Daily Revenue Per DAU (“ARPDAU”): ARPDAU is defined for a given period as the average daily revenue per average DAU and is calculated as game and advertising revenue for the period, divided by the number of days in the period, divided by the average DAU during the period. We use ARPDAU as a measure of overall monetization of our players. playAWARDS Platform Metrics Available Rewards: Available Rewards is defined as the monthly average number of unique rewards available in our applications’ rewards stores. A reward appearing in more than one application’s reward store is counted only once. A reward is counted only once irrespective of the inventory available through that reward. For example, one reward for a free night in a hotel room with ten rooms available for such free night is counted as one reward. Available Rewards only include real-world partner rewards and exclude PLAYSTUDIOS digital rewards. We use Available Rewards as a measure of the value and potential impact of the program for an interested player. It is assumed that the greater the variety and breadth of rewards offered, the more likely players will be to ascribe value to the program. Purchases: Purchases is defined as the total number of rewards purchased for the period identified in which a player exchanges loyalty points for a reward. Purchases are not adjusted for refunds. Purchases only include purchases of real-world partner rewards and exclude any PLAYSTUDIOS digital rewards. The Company does not receive any compensation or revenues from Purchases. We use Purchases as a measure of audience interest and engagement with our playAWARDS platform. Retail Value of Purchases: Retail Value of Purchases is defined as the cumulative retail value of all rewards listed as Purchases for the period identified. The retail value of each reward listed as Purchases is the retail value as determined by the partner upon creation of the reward. In the case where the retail value of a reward adjusts depending on time of redemption, the average retail value is used. Retail Value of Purchases only include the retail value of real-world partner rewards and exclude the cost of any PLAYSTUDIOS branded merchandise. Real-world Partner rewards are provided at no cost to the Company. We use Retail Value of Purchases to help us understand the real-world value of the rewards that are purchased by our active players.

E A R N I N G S U P D A T E ( 4 T H Q u a r t e r & Ye a r - E n d 2 0 2 1 )

• Investment Highlights • Vision • Business Overview • Performance • Financials AGENDA
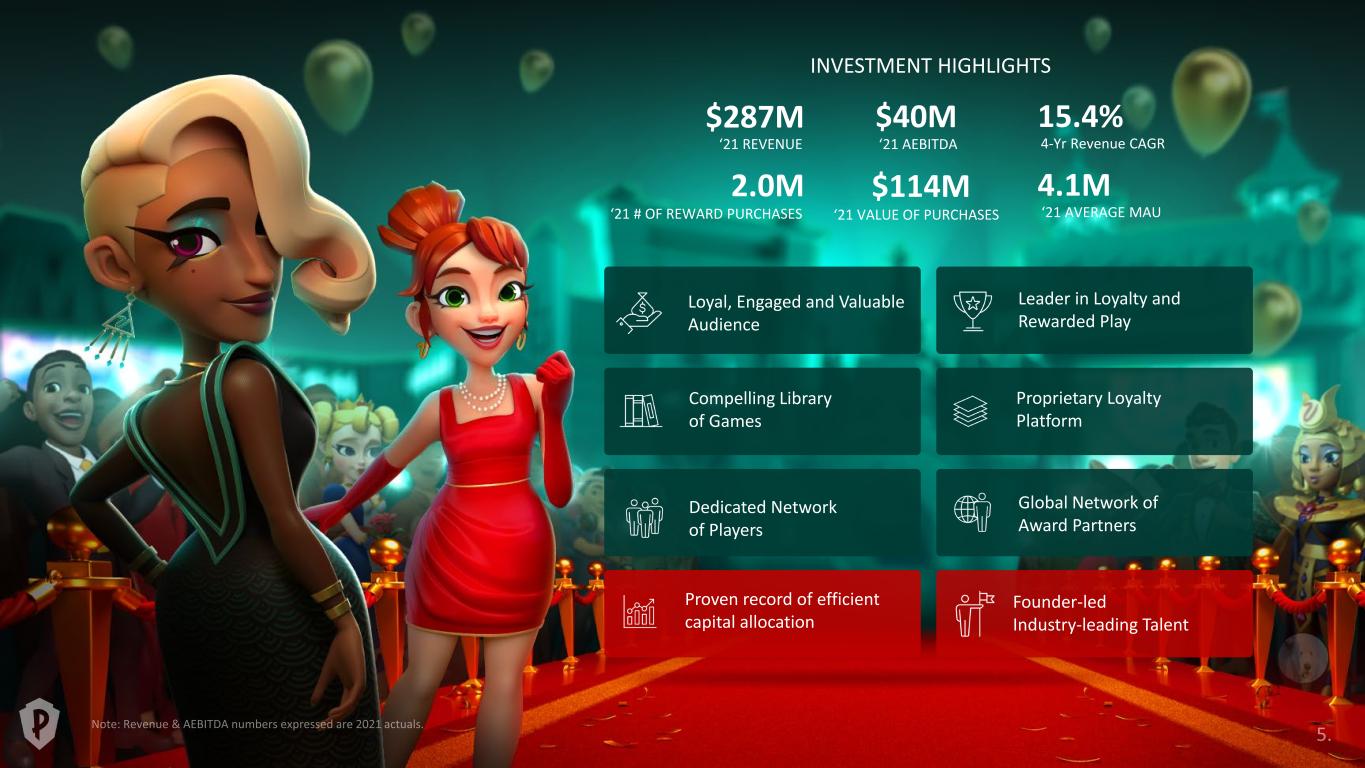
Founder-led Industry-leading Talent Loyal, Engaged and Valuable Audience Compelling Library of Games Proven record of efficient capital allocation Leader in Loyalty and Rewarded Play Global Network of Award Partners Dedicated Network of Players $40M ‘21 AEBITDA $114M ‘21 VALUE OF PURCHASES 15.4% 4-Yr Revenue CAGR 4.1M ‘21 AVERAGE MAU $287M ‘21 REVENUE 2.0M ‘21 # OF REWARD PURCHASES INVESTMENT HIGHLIGHTS Proprietary Loyalty Platform

V I S I O N

Dominate Rewarded Play.
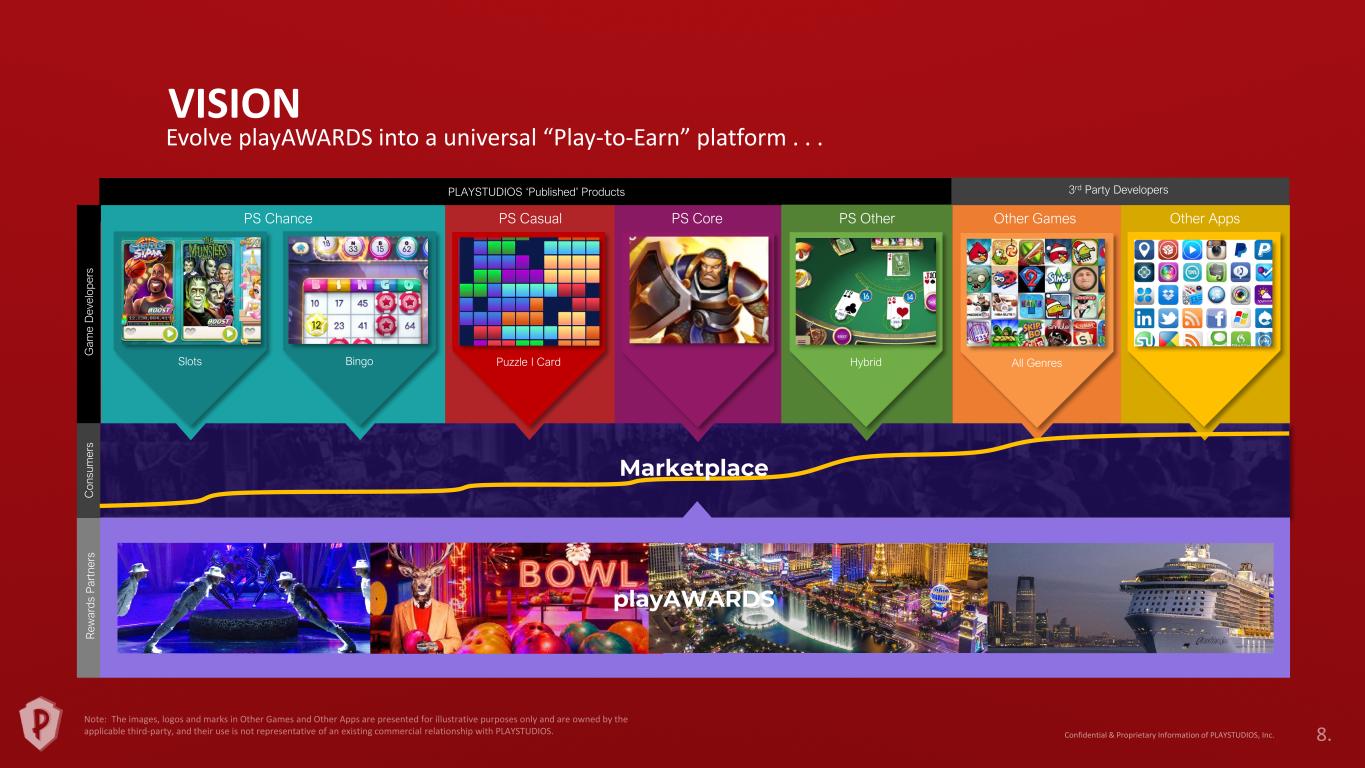
PS Chance PS Casual PS Core PS Other Other Apps RPG I Strategy BingoSlots Puzzle I Card R ew ar ds P ar tn er s C on su m er s G am e D ev el op er s Other Games Hybrid All Genres VISION Evolve playAWARDS into a universal “Play-to-Earn” platform . . . PLAYSTUDIOS ‘Published’ Products 3rd Party Developers playAWARDS Marketplace
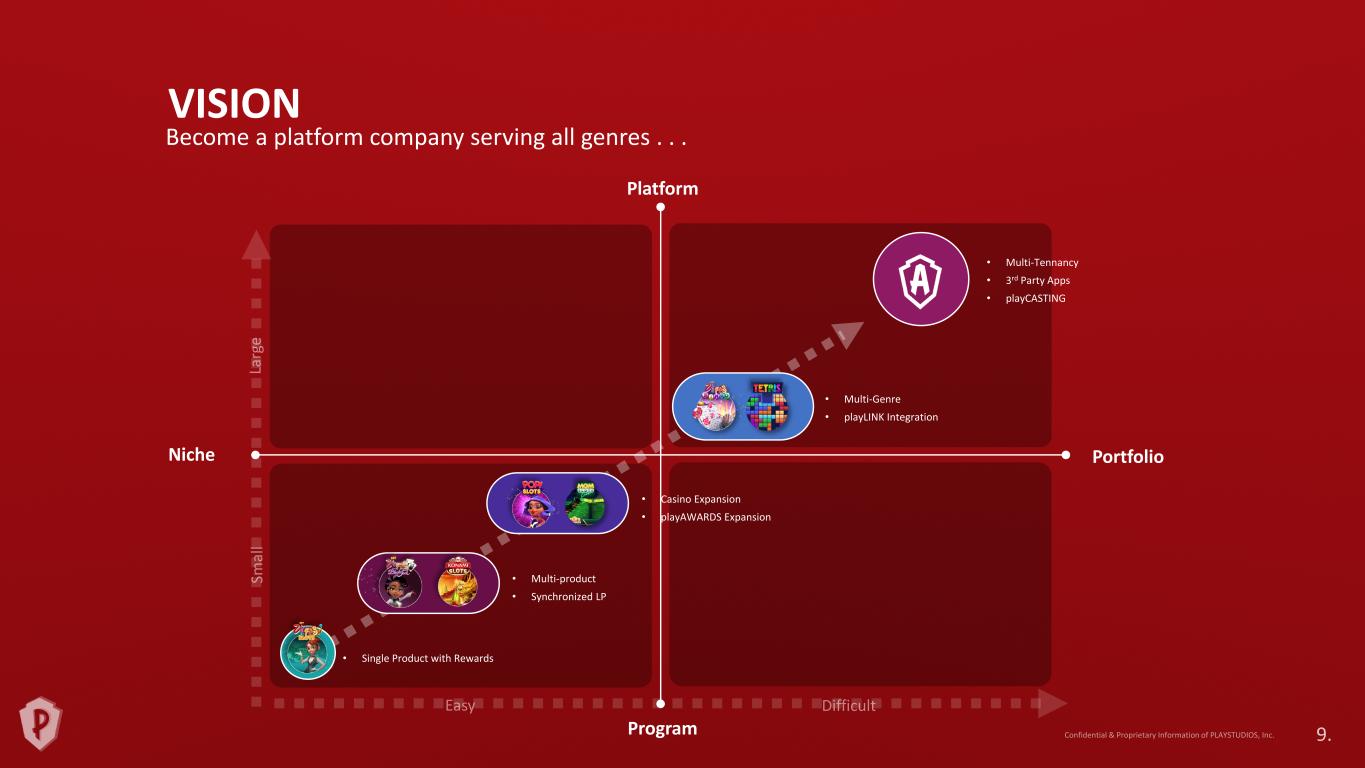
Become a platform company serving all genres . . . Platform Program Niche Portfolio • Multi-Tennancy • 3rd Party Apps • playCASTING • Multi-Genre • playLINK Integration • Casino Expansion • playAWARDS Expansion • Multi-product • Synchronized LP • Single Product with Rewards VISION
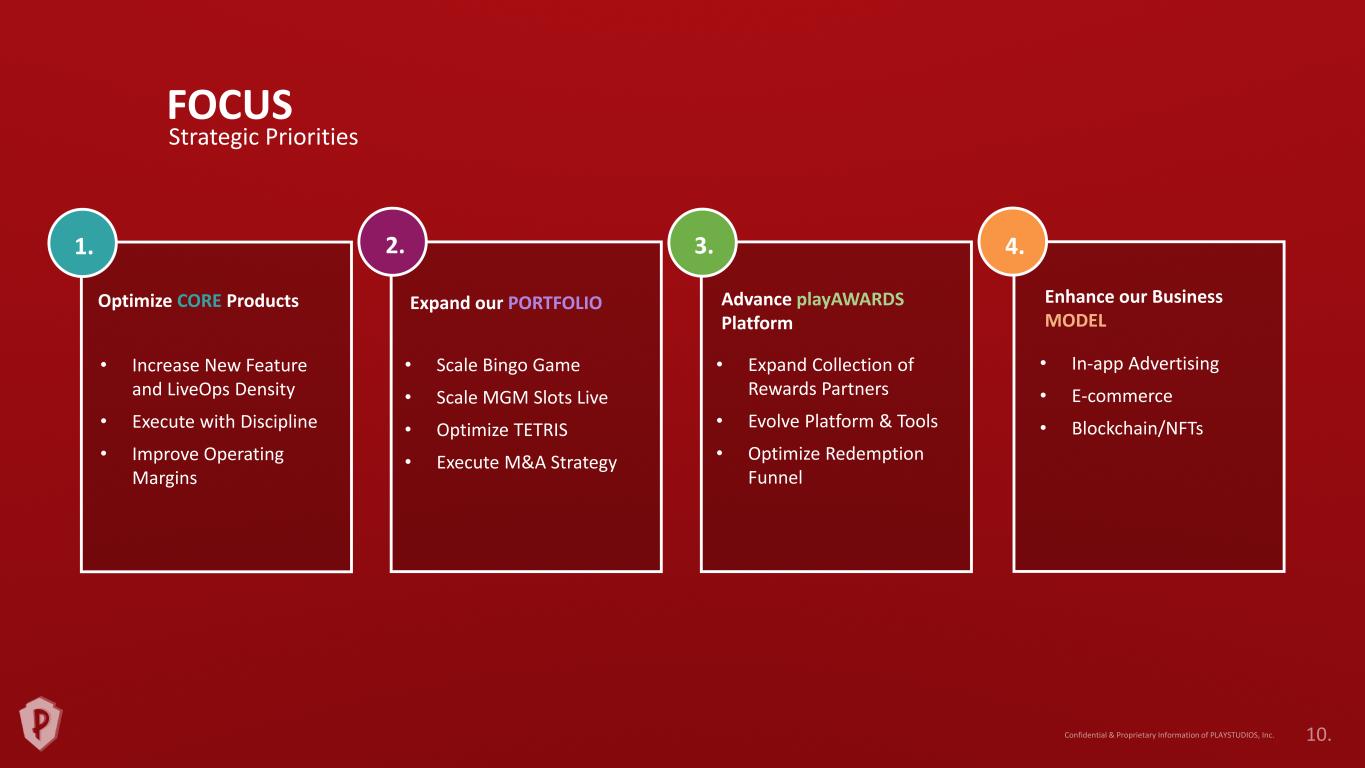
FOCUS Strategic Priorities Optimize CORE Products • Increase New Feature and LiveOps Density • Execute with Discipline • Improve Operating Margins 1. Expand our PORTFOLIO 2. • Scale Bingo Game • Scale MGM Slots Live • Optimize TETRIS • Execute M&A Strategy Advance playAWARDS Platform 3. • Expand Collection of Rewards Partners • Evolve Platform & Tools • Optimize Redemption Funnel Enhance our Business MODEL 4. • In-app Advertising • E-commerce • Blockchain/NFTs

B U S I N E S S O V E R V I E W
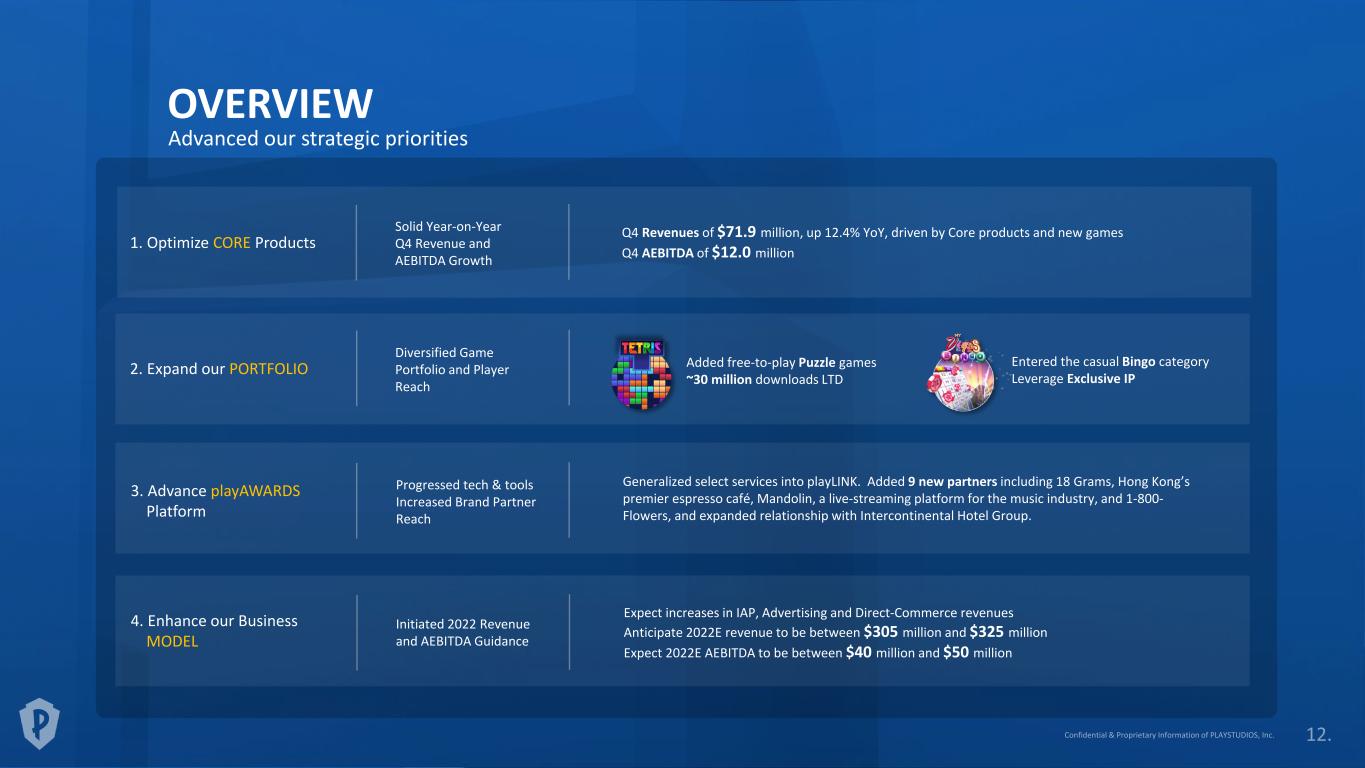
OVERVIEW 1. Optimize CORE Products 2. Expand our PORTFOLIO 3. Advance playAWARDS Platform 4. Enhance our Business MODEL Q4 Revenues of $71.9 million, up 12.4% YoY, driven by Core products and new games Q4 AEBITDA of $12.0 million Generalized select services into playLINK. Added 9 new partners including 18 Grams, Hong Kong’s premier espresso café, Mandolin, a live-streaming platform for the music industry, and 1-800- Flowers, and expanded relationship with Intercontinental Hotel Group. Expect increases in IAP, Advertising and Direct-Commerce revenues Anticipate 2022E revenue to be between $305 million and $325 million Expect 2022E AEBITDA to be between $40 million and $50 million Added free-to-play Puzzle games ~30 million downloads LTD Entered the casual Bingo category Leverage Exclusive IP Solid Year-on-Year Q4 Revenue and AEBITDA Growth Diversified Game Portfolio and Player Reach Progressed tech & tools Increased Brand Partner Reach Initiated 2022 Revenue and AEBITDA Guidance Advanced our strategic priorities
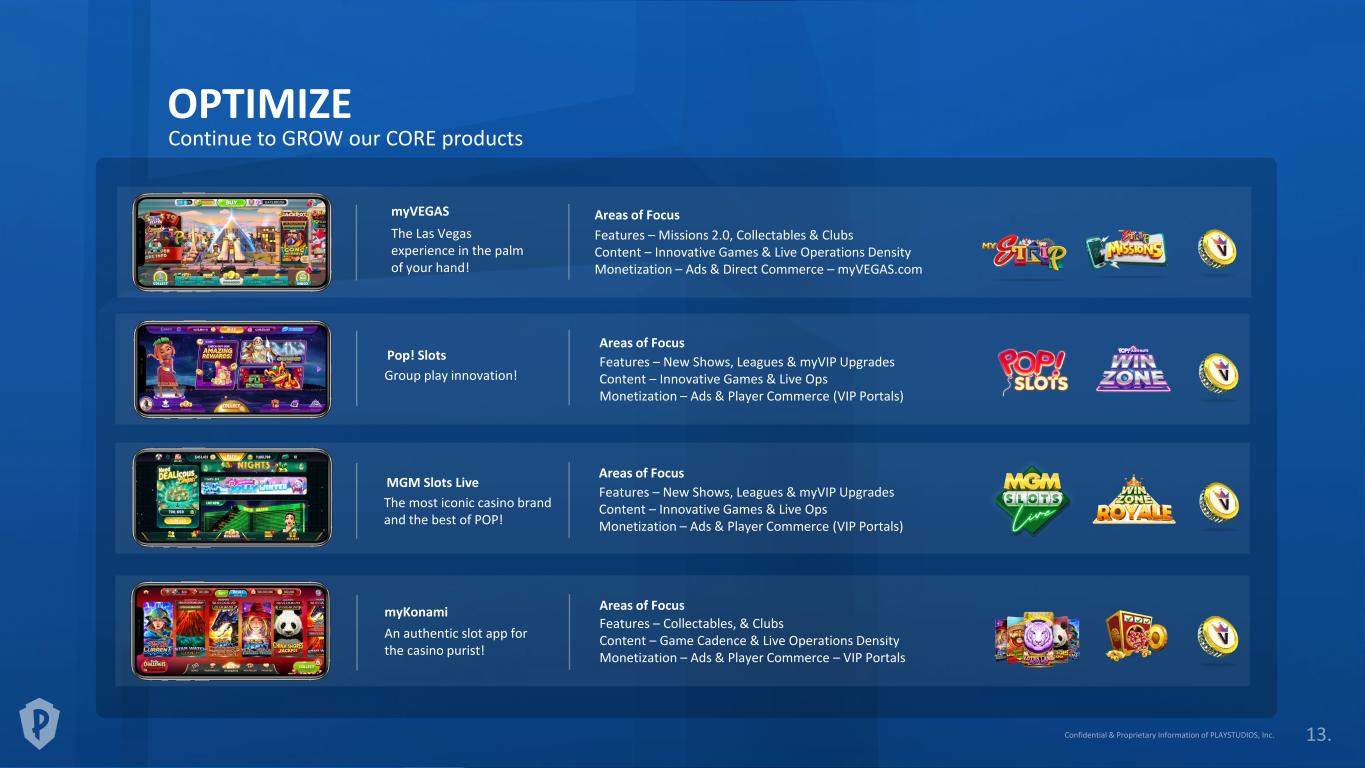
OPTIMIZE The Las Vegas experience in the palm of your hand! myVEGAS Group play innovation! Pop! Slots An authentic slot app for the casino purist! myKonami The most iconic casino brand and the best of POP! MGM Slots Live Areas of Focus Features – New Shows, Leagues & myVIP Upgrades Content – Innovative Games & Live Ops Monetization – Ads & Player Commerce (VIP Portals) Areas of Focus Features – Collectables, & Clubs Content – Game Cadence & Live Operations Density Monetization – Ads & Player Commerce – VIP Portals Areas of Focus Features – Missions 2.0, Collectables & Clubs Content – Innovative Games & Live Operations Density Monetization – Ads & Direct Commerce – myVEGAS.com Areas of Focus Features – New Shows, Leagues & myVIP Upgrades Content – Innovative Games & Live Ops Monetization – Ads & Player Commerce (VIP Portals) Continue to GROW our CORE products
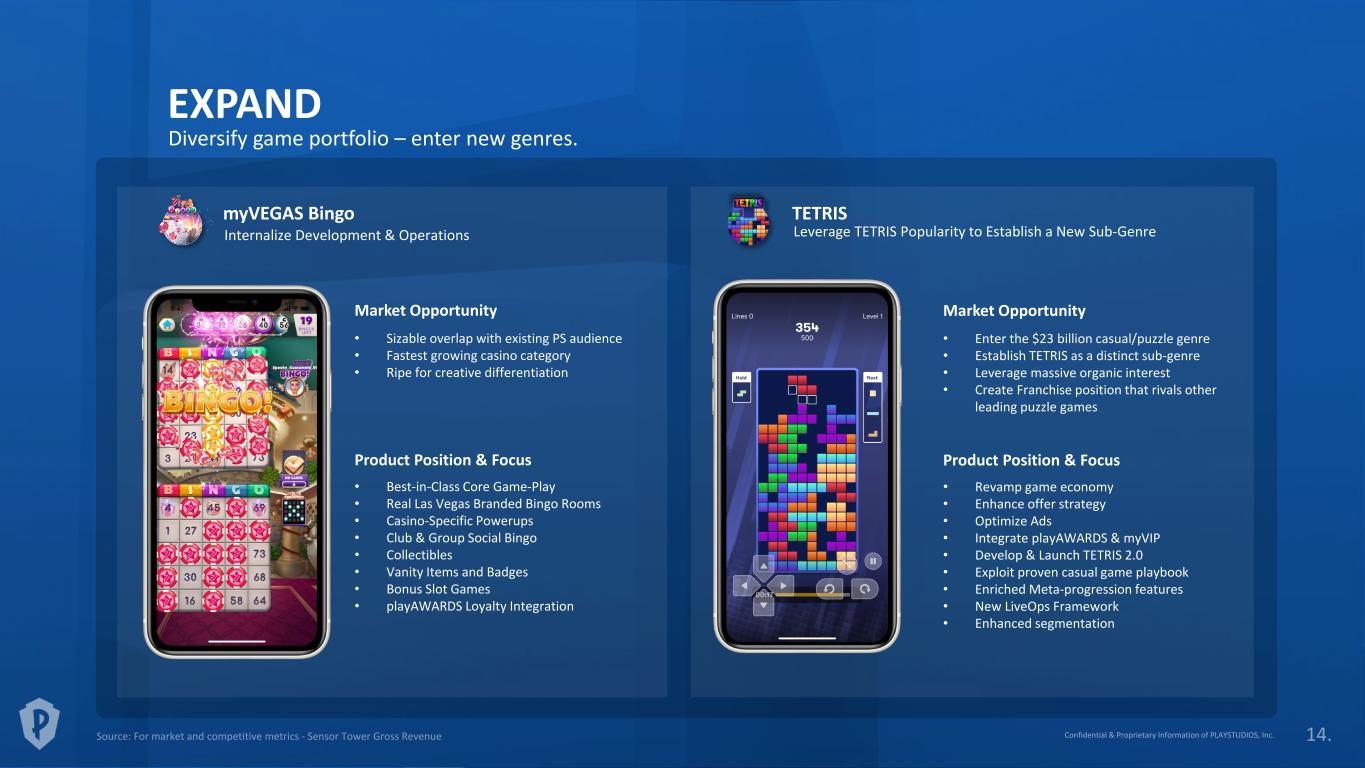
EXPAND Diversify game portfolio – enter new genres. • Best-in-Class Core Game-Play • Real Las Vegas Branded Bingo Rooms • Casino-Specific Powerups • Club & Group Social Bingo • Collectibles • Vanity Items and Badges • Bonus Slot Games • playAWARDS Loyalty Integration Product Position & Focus Market Opportunity • Sizable overlap with existing PS audience • Fastest growing casino category • Ripe for creative differentiation • Revamp game economy • Enhance offer strategy • Optimize Ads • Integrate playAWARDS & myVIP • Develop & Launch TETRIS 2.0 • Exploit proven casual game playbook • Enriched Meta-progression features • New LiveOps Framework • Enhanced segmentation Product Position & Focus Market Opportunity • Enter the $23 billion casual/puzzle genre • Establish TETRIS as a distinct sub-genre • Leverage massive organic interest • Create Franchise position that rivals other leading puzzle games myVEGAS Bingo TETRIS Internalize Development & Operations Leverage TETRIS Popularity to Establish a New Sub-Genre
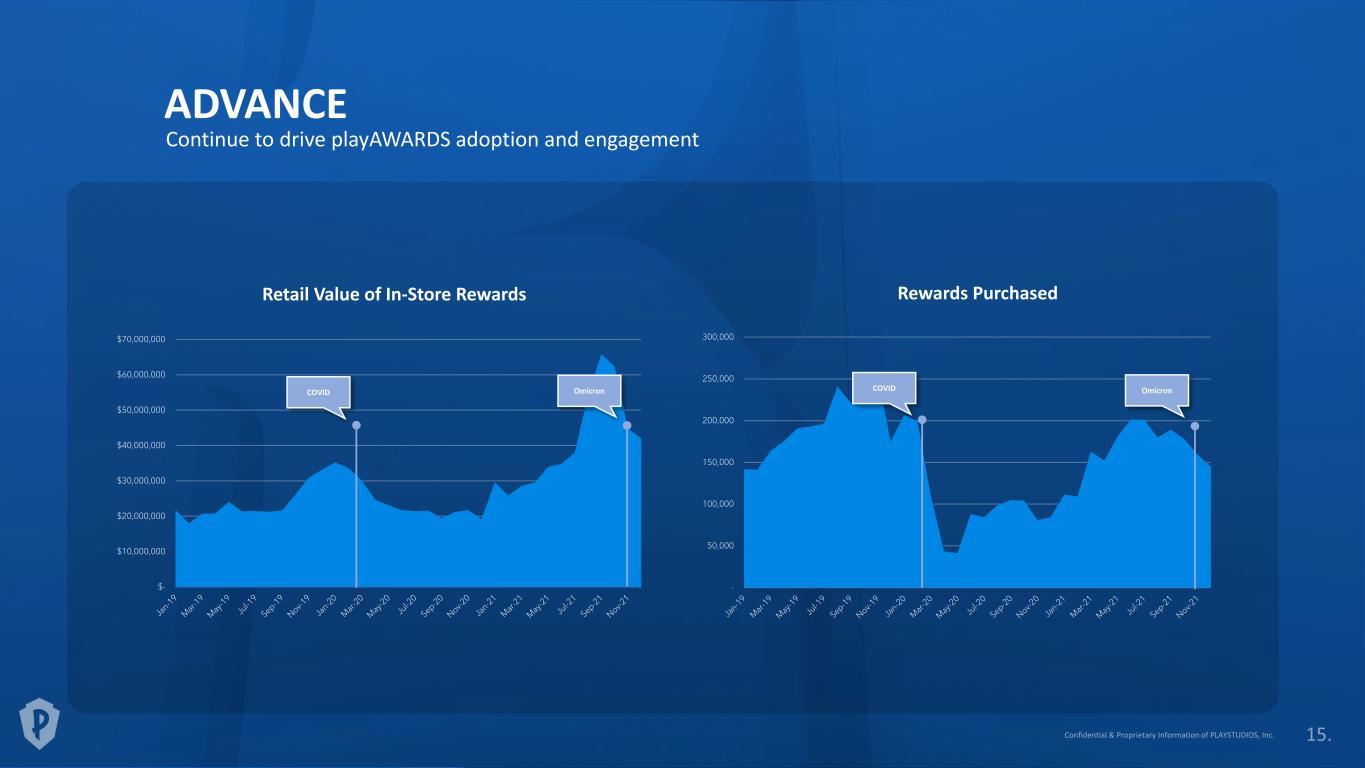
Continue to drive playAWARDS adoption and engagement ADVANCE Retail Value of In-Store Rewards $- $10,000,000 $20,000,000 $30,000,000 $40,000,000 $50,000,000 $60,000,000 $70,000,000 COVID Omicron - 50,000 100,000 150,000 200,000 250,000 300,000 COVID Omicron Rewards Purchased

P E R F O R M A N C E
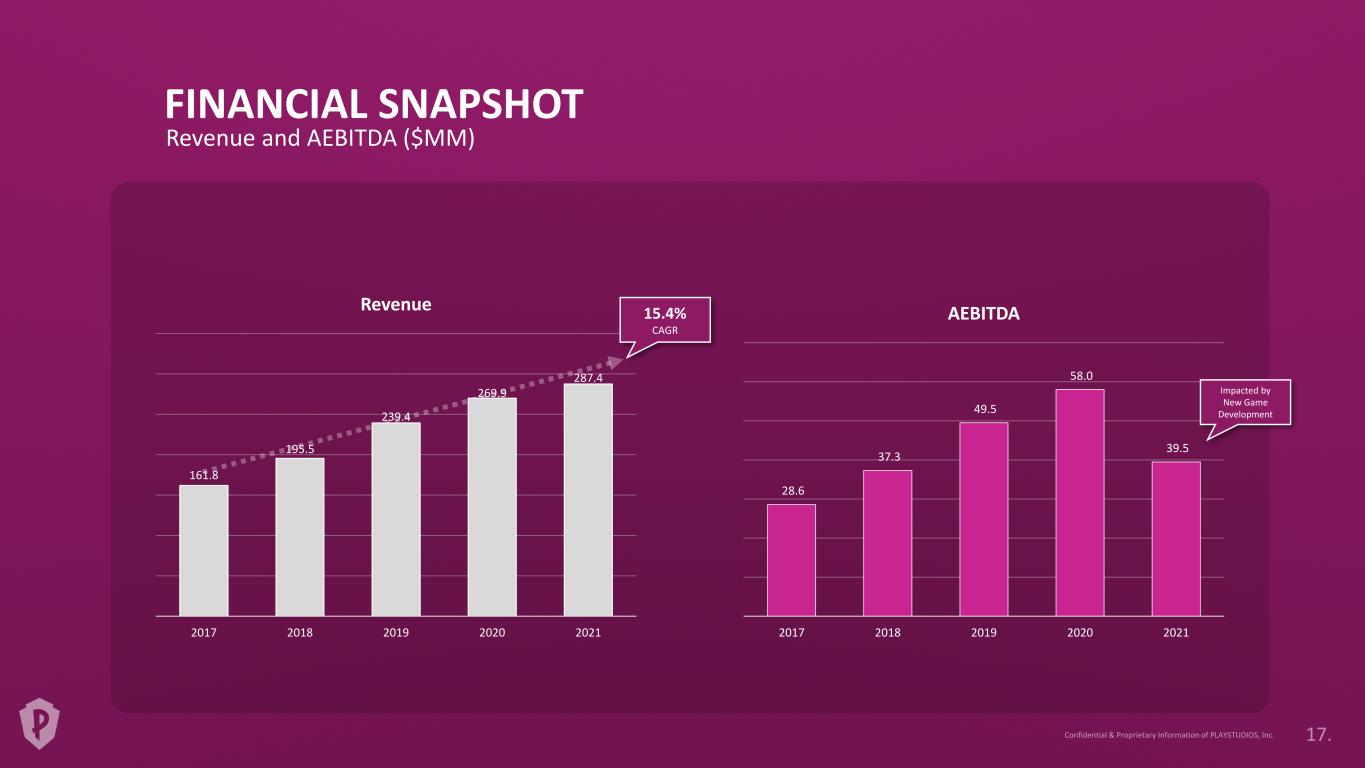
28.6 37.3 49.5 58.0 39.5 2017 2018 2019 2020 2021 AEBITDA 161.8 195.5 239.4 269.9 287.4 2017 2018 2019 2020 2021 Revenue Revenue and AEBITDA ($MM) FINANCIAL SNAPSHOT 15.4% CAGR Impacted by New Game Development
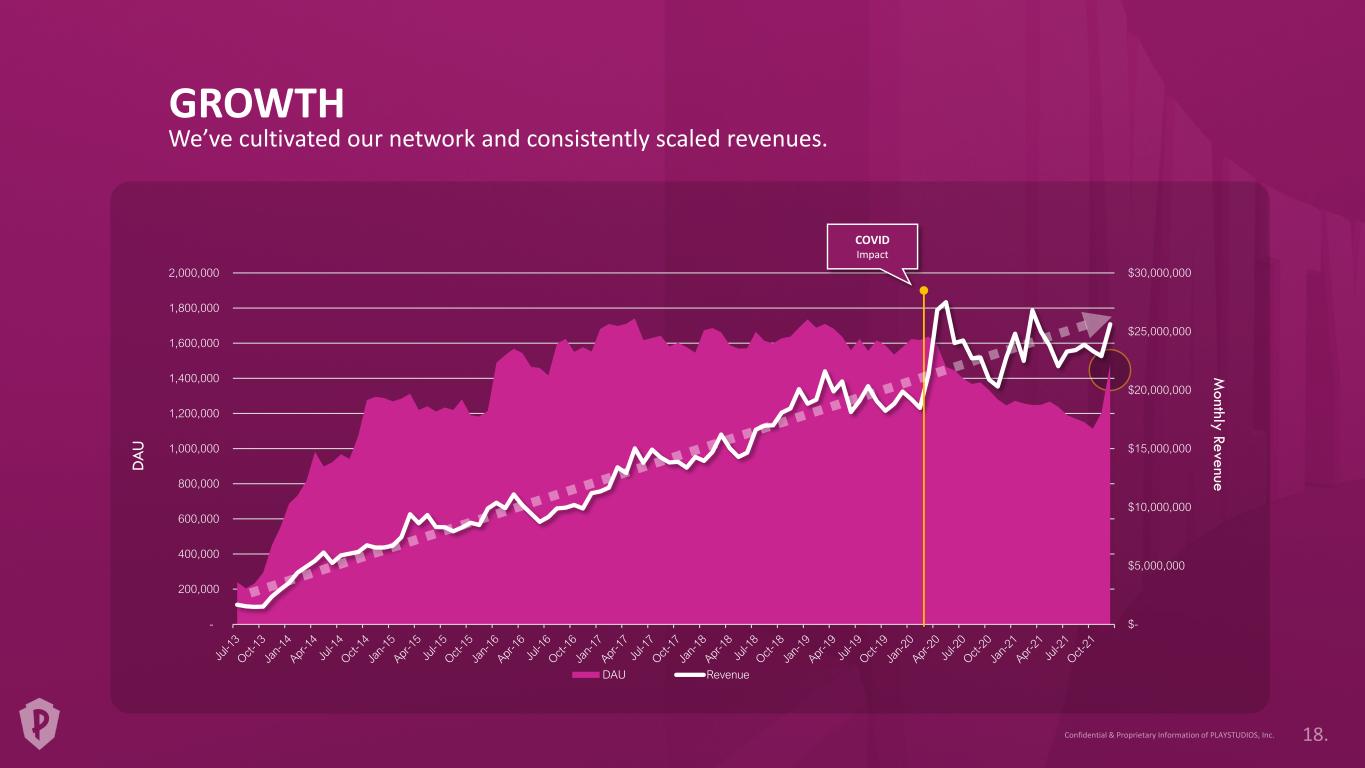
$- $5,000,000 $10,000,000 $15,000,000 $20,000,000 $25,000,000 $30,000,000 - 200,000 400,000 600,000 800,000 1,000,000 1,200,000 1,400,000 1,600,000 1,800,000 2,000,000 DAU Revenue GROWTH We’ve cultivated our network and consistently scaled revenues. DA U M onthly Revenue COVID Impact
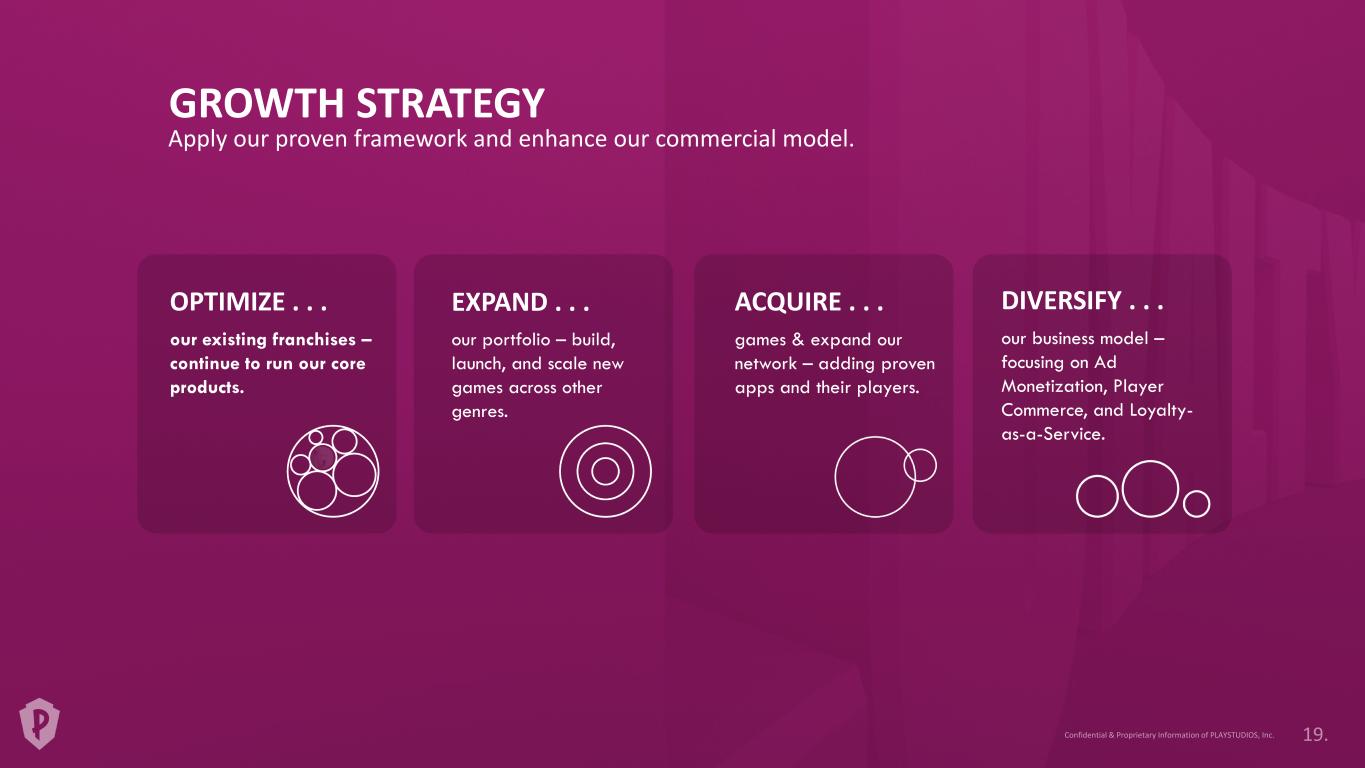
GROWTH STRATEGY Apply our proven framework and enhance our commercial model. OPTIMIZE . . . our existing franchises – continue to run our core products. EXPAND . . . our portfolio – build, launch, and scale new games across other genres. ACQUIRE . . . games & expand our network – adding proven apps and their players. DIVERSIFY . . . our business model – focusing on Ad Monetization, Player Commerce, and Loyalty- as-a-Service.
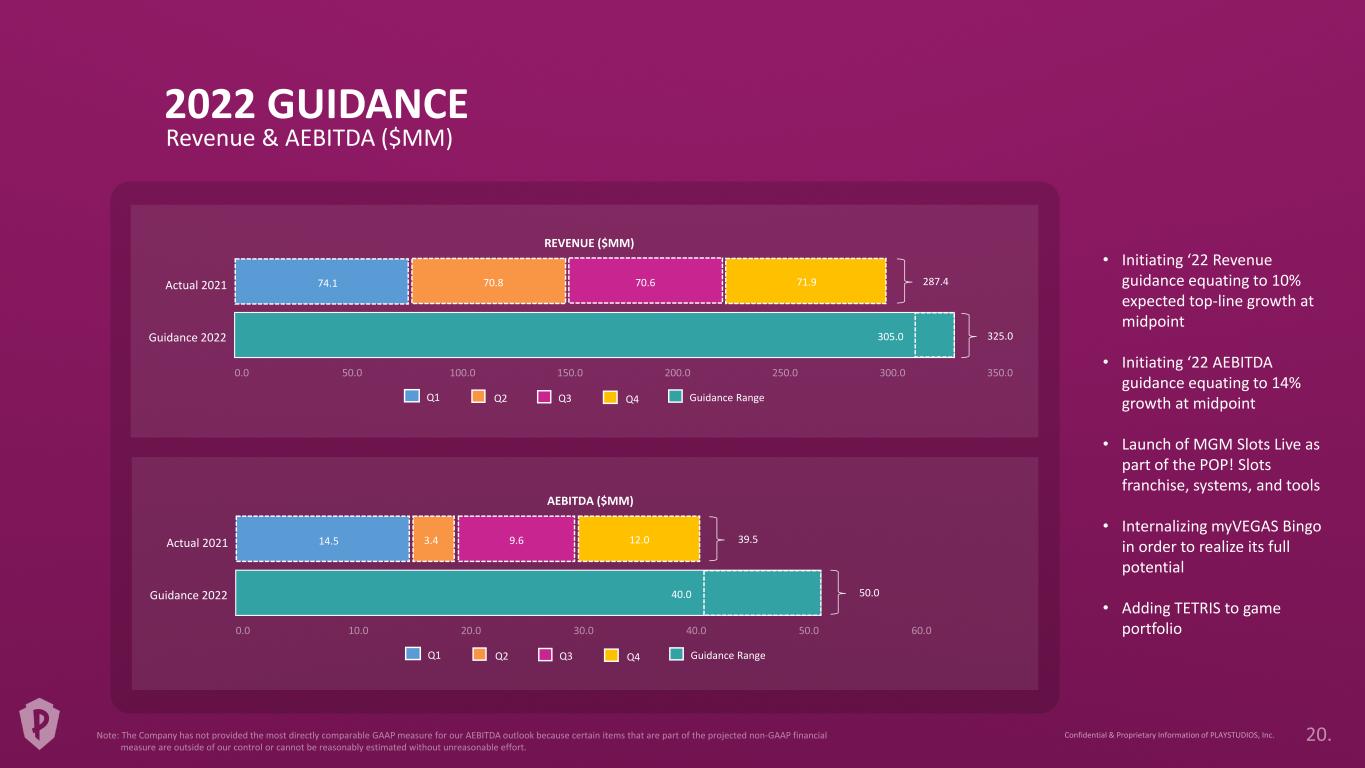
Revenue & AEBITDA ($MM) 2022 GUIDANCE 74.1 70.8 70.6 71.9 287.4 325.0305.0 Actual 2021 Guidance 2022 REVENUE ($MM) Guidance RangeQ1 Q2 Q3 Q4 14.5 3.4 9.6 12.0 39.5 50.040.0 Actual 2021 Guidance 2022 AEBITDA ($MM) Guidance RangeQ1 Q2 Q3 Q4 • Initiating ‘22 Revenue guidance equating to 10% expected top-line growth at midpoint • Initiating ‘22 AEBITDA guidance equating to 14% growth at midpoint • Launch of MGM Slots Live as part of the POP! Slots franchise, systems, and tools • Internalizing myVEGAS Bingo in order to realize its full potential • Adding TETRIS to game portfolio

F I N A N C I A L S
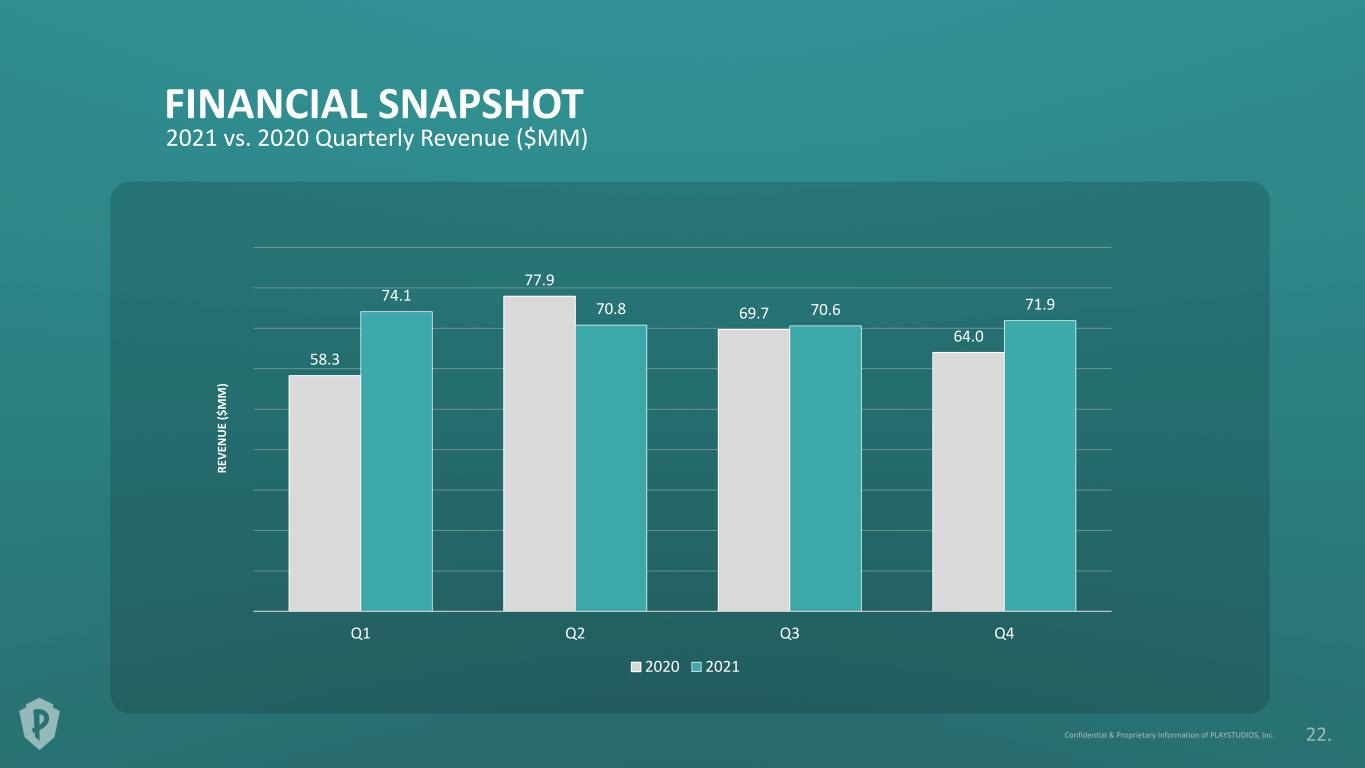
2021 vs. 2020 Quarterly Revenue ($MM) FINANCIAL SNAPSHOT 58.3 77.9 69.7 64.0 74.1 70.8 70.6 71.9 Q1 Q2 Q3 Q4 2020 2021 RE VE N U E ($ M M )
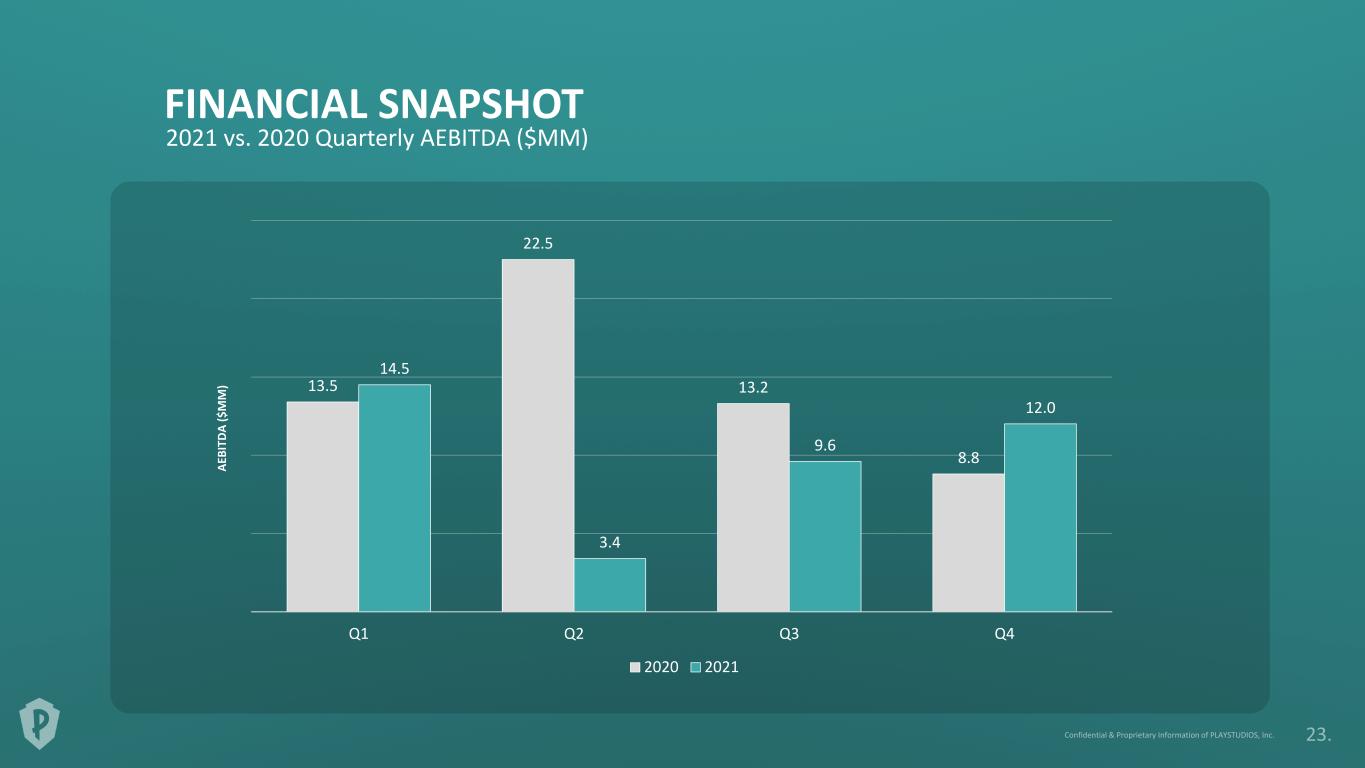
13.5 22.5 13.2 8.8 14.5 3.4 9.6 12.0 Q1 Q2 Q3 Q4 2020 2021 2021 vs. 2020 Quarterly AEBITDA ($MM) FINANCIAL SNAPSHOT AE BI TD A ($ M M )
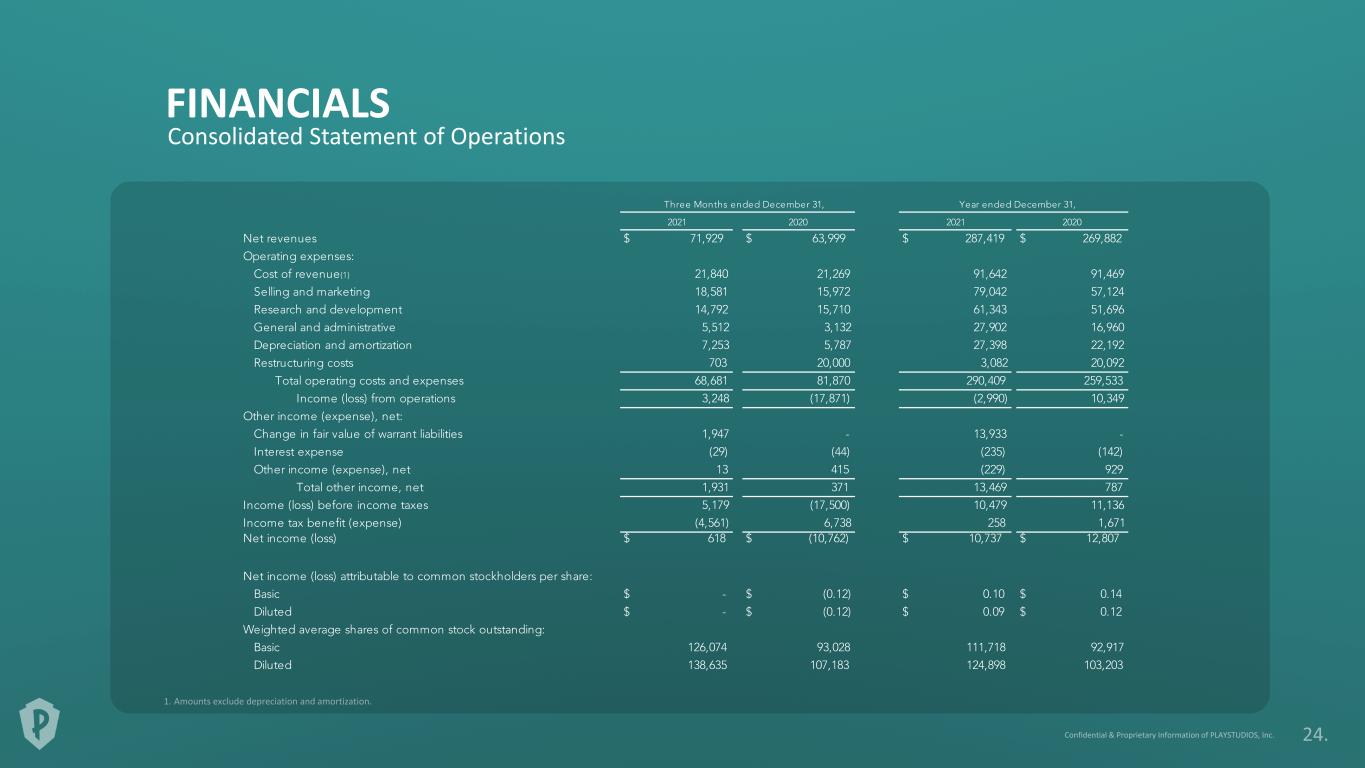
FINANCIALS Consolidated Statement of Operations
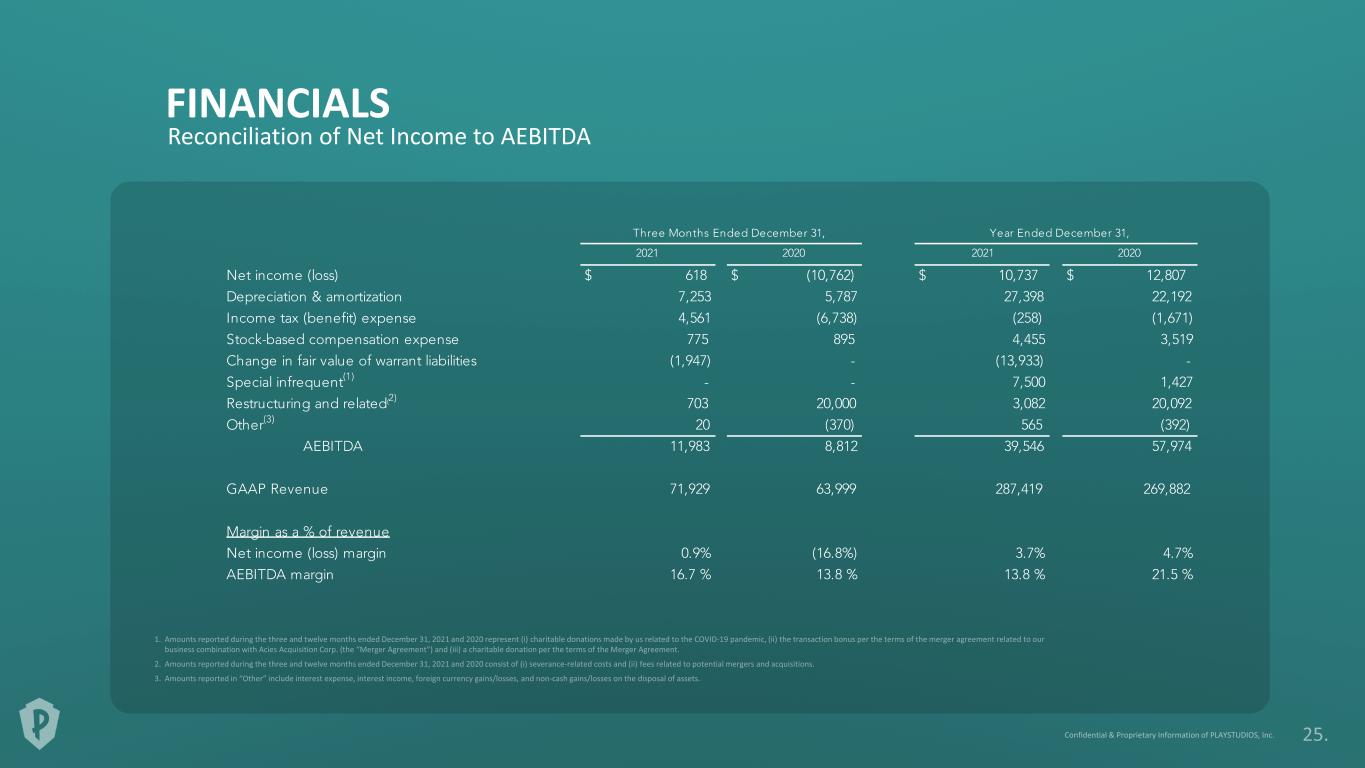
FINANCIALS Reconciliation of Net Income to AEBITDA
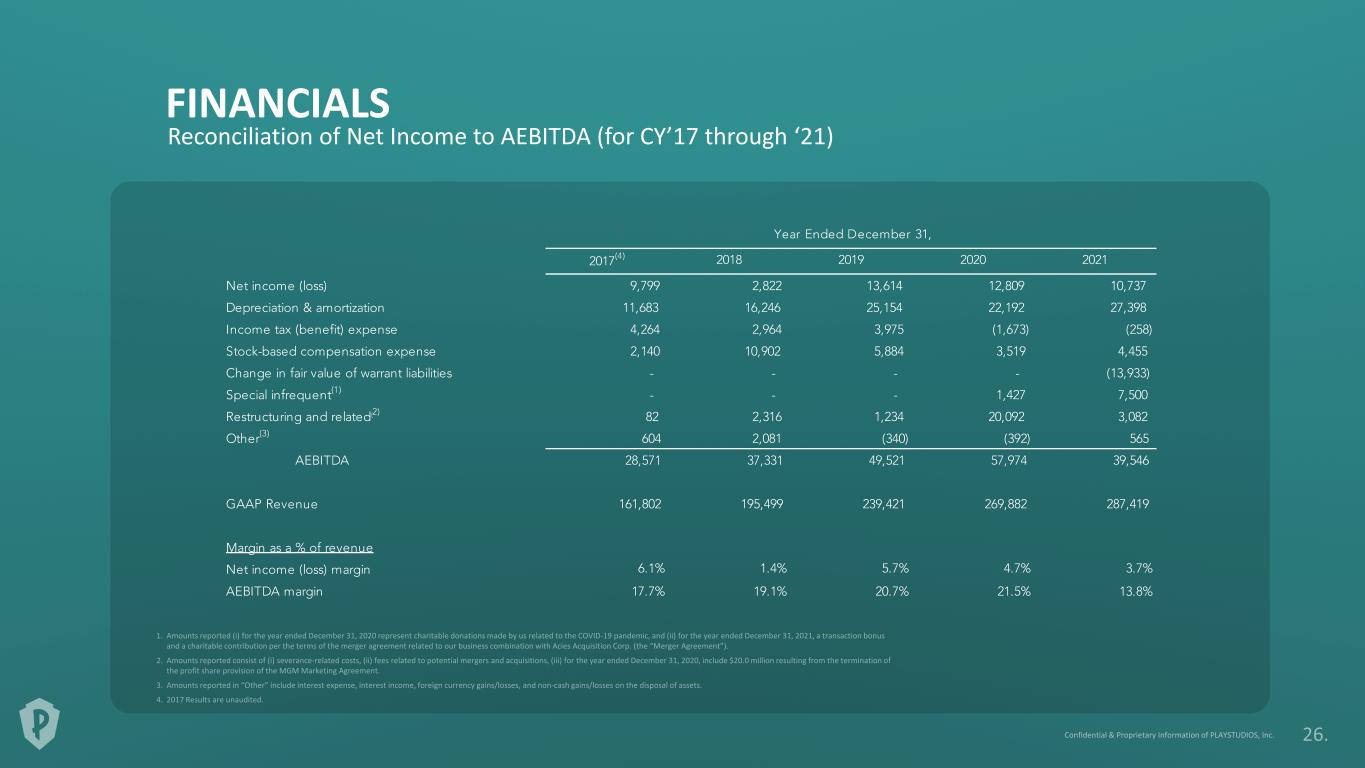
FINANCIALS Reconciliation of Net Income to AEBITDA (for CY’17 through ‘21)
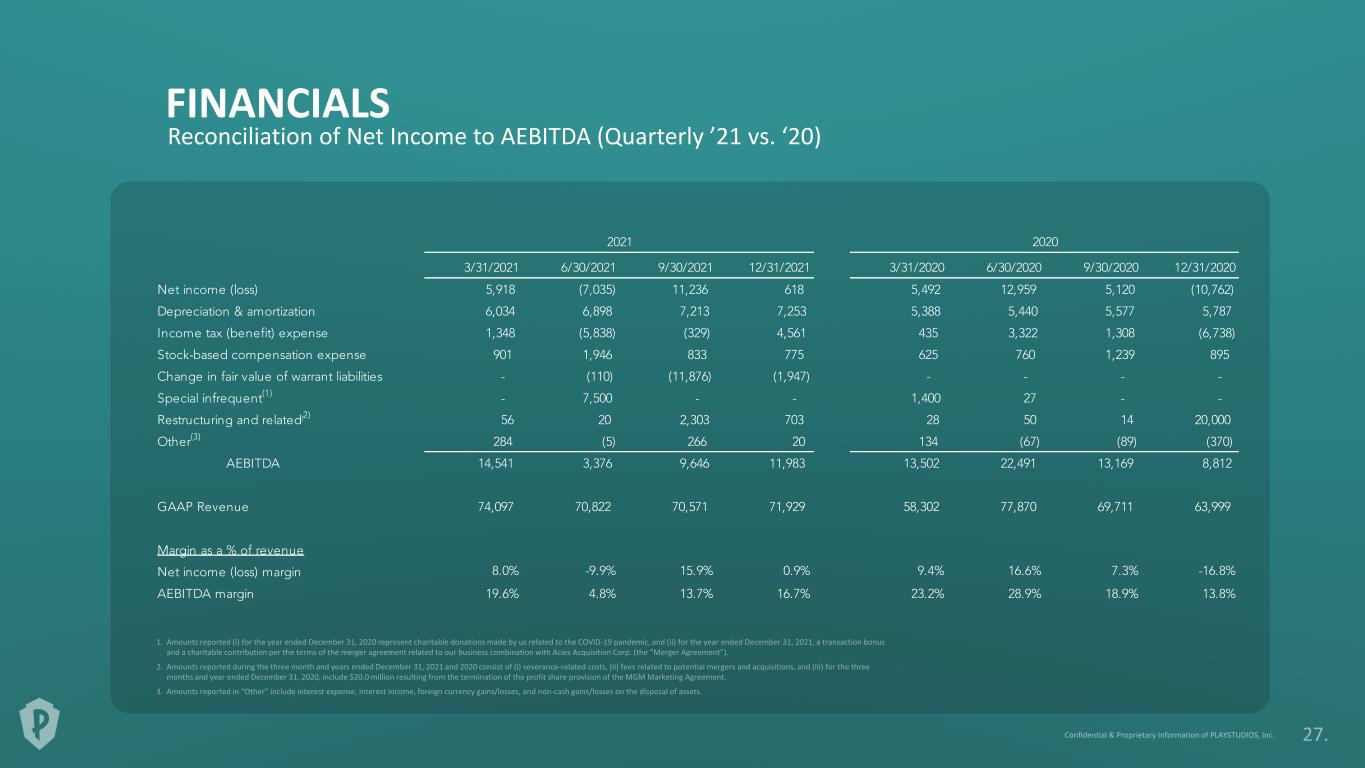
FINANCIALS Reconciliation of Net Income to AEBITDA (Quarterly ’21 vs. ‘20)

t h a n k y o u !