2023, January 10th Investor Presentation. An Introduction to PLAYSTUDIOS, Inc. Display Version
Disclaimer Forward-Looking Statements This presentation contains forward-looking statements that relate to anticipated future events, including anticipated future operating results, business performance, and financial conditions. The company’s actual results may differ from the company’s current expectations, estimates and projections and consequently, you should not rely on these forward-looking statements as predictions of future events or results. In some cases, forward-looking statements will be identified by words such as “expect,” “estimate,” “project,” “budget,” “forecast,” “anticipate,” “intend,” “plan,” “may,” “will,” “could,” “should,” “believes,” “predicts,” “potential,” “continue,” and similar expressions. These forward-looking statements are subject to risks, uncertainties and other factors that could cause the actual results to differ materially from those expressed or implied by such forward-looking statements. Most of these risks, uncertainties and other factors are outside the company’s control and are difficult to predict. Factors that could impact the company’s future performance and cause actual results to differ from the forward-looking statements contained in this presentation include, but are not limited to, risks and uncertainties identified from time to time in the company’s filings with the U.S. Securities and Exchange Commission (the “SEC”). In addition, forward-looking statements contained in this presentation are based on assumptions that the company believes to be reasonable as of this date. The company undertakes no obligation to update any forward-looking statements to reflect events or circumstances after the date of this presentation or to reflect new information or the occurrence of unanticipated events, except as required by law. Unaudited and Non-GAAP Financial Measures This presentation contains financial data that is not audited and financial data that was not prepared in accordance with U.S. Generally Accepted Accounting Principles (“GAAP). PLAYSTUDIOS uses certain non-GAAP financial measures, including Adjusted EBITDA, to analyze underlying business performance and trends. The company believes the presentation of these non-GAAP financial measures provides useful information to investors and management in analyzing and benchmarking the financial and operating performance of the company’s business. Non-GAAP financial measures are not measures of financial performance determined in accordance with GAAP and should not be considered a substitute for, or superior to, financial measures determined or calculated in accordance with GAAP. The non-GAAP financial measures contained in this presentation are not meant to be considered in isolation or as a substitute for comparable GAAP measures and should be read in conjunction with PLAYSTUDIOS’ consolidated financial statements prepared in accordance with GAAP. In addition, non-GAAP measures contained in this presentation reflect the exercise of management’s judgment regarding which items are included or excluded in their determination, and as a result the company’s definitions of non-GAAP financial measures may not be comparable to similarly titled measures reported by other companies. Please refer to our SEC filings for reconciliation of the non-GAAP financial measures contained herein to the most directly comparable measures in accordance with GAAP. Key Performance Indicators We manage our business by regularly reviewing several key operating metrics to track historical performance, identify trends in player activity, and set strategic goals for the future. Our key performance metrics are impacted by several factors that could cause them to fluctuate on a quarterly basis, such as platform providers’ policies, seasonality, player connectivity, and the addition of new content to games. The key performance indicators may differ from similarly titled measures presented by other companies. For more information on our key performance indicators, please refer to the definitions and additional information contained in our SEC filings. Industry Data This presentation refers to, and in some cases relies upon, certain information, statistics and forecasts obtained from third-party sources. While the company believes such third-party sources to be reliable, the company has not independently verified the accuracy completeness of any such third-party data. This presentation contains trademarks, service marks, trade names and copyrights of PLAYSTUDIOS and other companies, which are the property of their respective owners.
Samir Jain Treasury & Investor Relations PLAYSTUDIOS samir.jain@playstudios.com
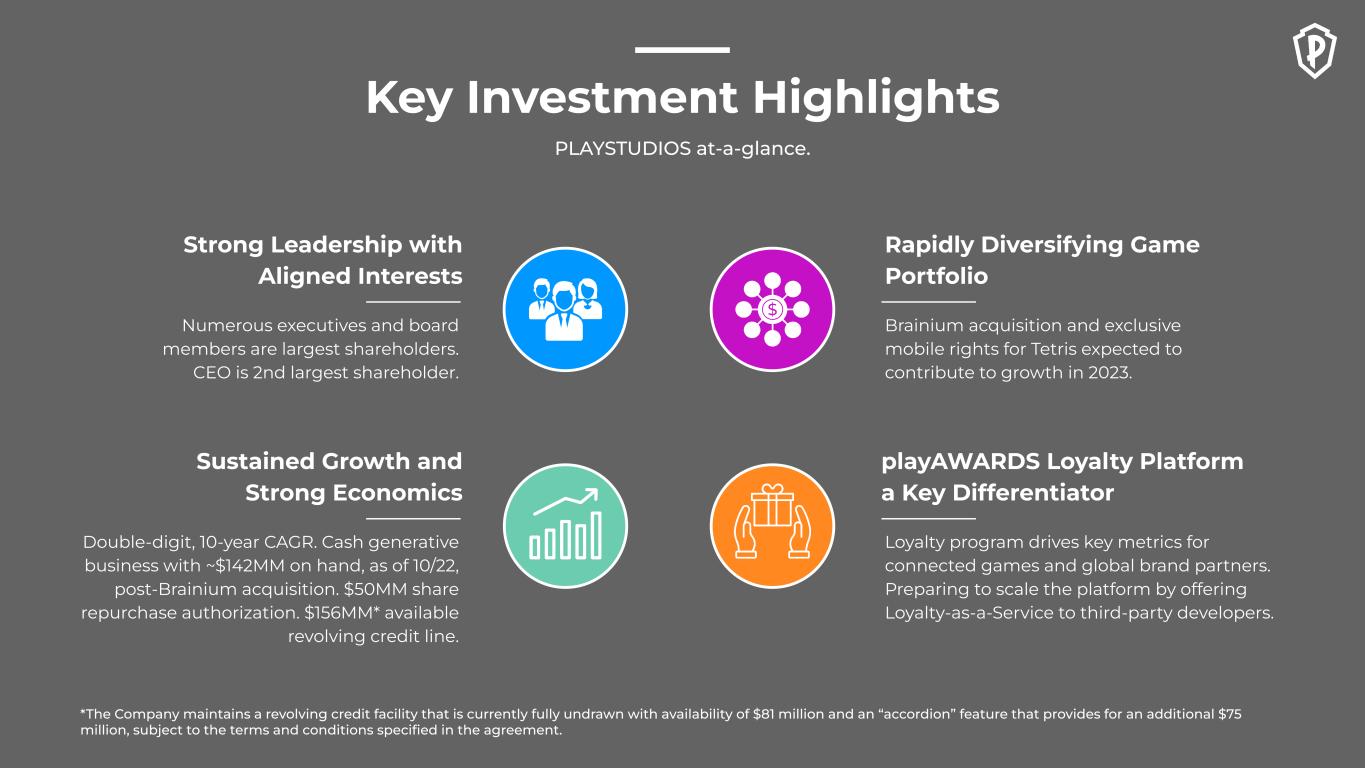
PLAYSTUDIOS at-a-glance. Key Investment Highlights Strong Leadership with Aligned Interests Numerous executives and board members are largest shareholders. CEO is 2nd largest shareholder. Rapidly Diversifying Game Portfolio Brainium acquisition and exclusive mobile rights for Tetris expected to contribute to growth in 2023. playAWARDS Loyalty Platform a Key Differentiator Loyalty program drives key metrics for connected games and global brand partners. Preparing to scale the platform by offering Loyalty-as-a-Service to third-party developers. *The Company maintains a revolving credit facility that is currently fully undrawn with availability of $81 million and an “accordion” feature that provides for an additional $75 million, subject to the terms and conditions specified in the agreement. Sustained Growth and Strong Economics Double-digit, 10-year CAGR. Cash generative business with ~$142MM on hand, as of 10/22, post-Brainium acquisition. $50MM share repurchase authorization. $156MM* available revolving credit line.
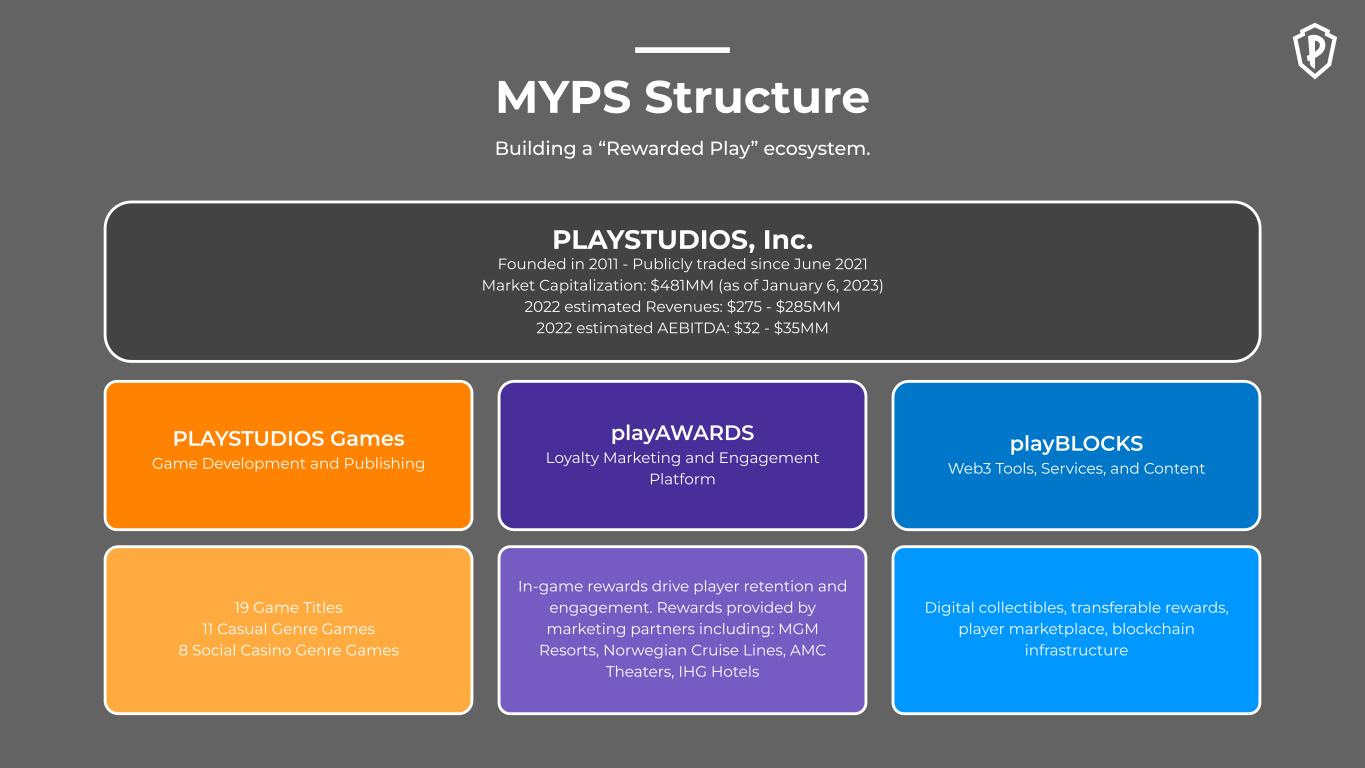
Building a “Rewarded Play” ecosystem. MYPS Structure playAWARDS Loyalty Marketing and Engagement Platform In-game rewards drive player retention and engagement. Rewards provided by marketing partners including: MGM Resorts, Norwegian Cruise Lines, AMC Theaters, IHG Hotels 19 Game Titles 11 Casual Genre Games 8 Social Casino Genre Games PLAYSTUDIOS Games Game Development and Publishing PLAYSTUDIOS, Inc. Founded in 2011 - Publicly traded since June 2021 Market Capitalization: $481MM (as of January 6, 2023) 2022 estimated Revenues: $275 - $285MM 2022 estimated AEBITDA: $32 - $35MM playBLOCKS Web3 Tools, Services, and Content Digital collectibles, transferable rewards, player marketplace, blockchain infrastructure
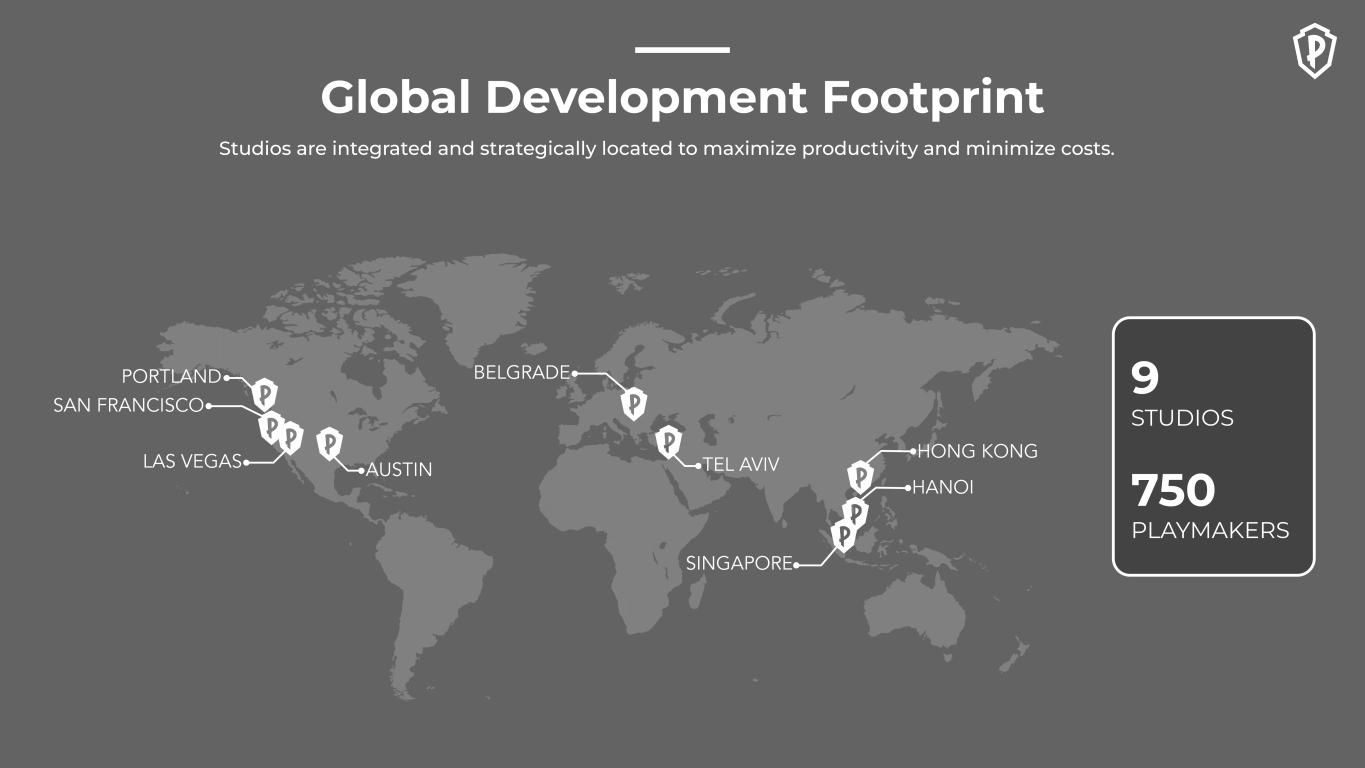
SAN FRANCISCO LAS VEGAS AUSTIN BELGRADE TEL AVIV HONG KONG SINGAPORE HANOI 9 STUDIOS 750 PLAYMAKERS PORTLAND Studios are integrated and strategically located to maximize productivity and minimize costs. Global Development Footprint
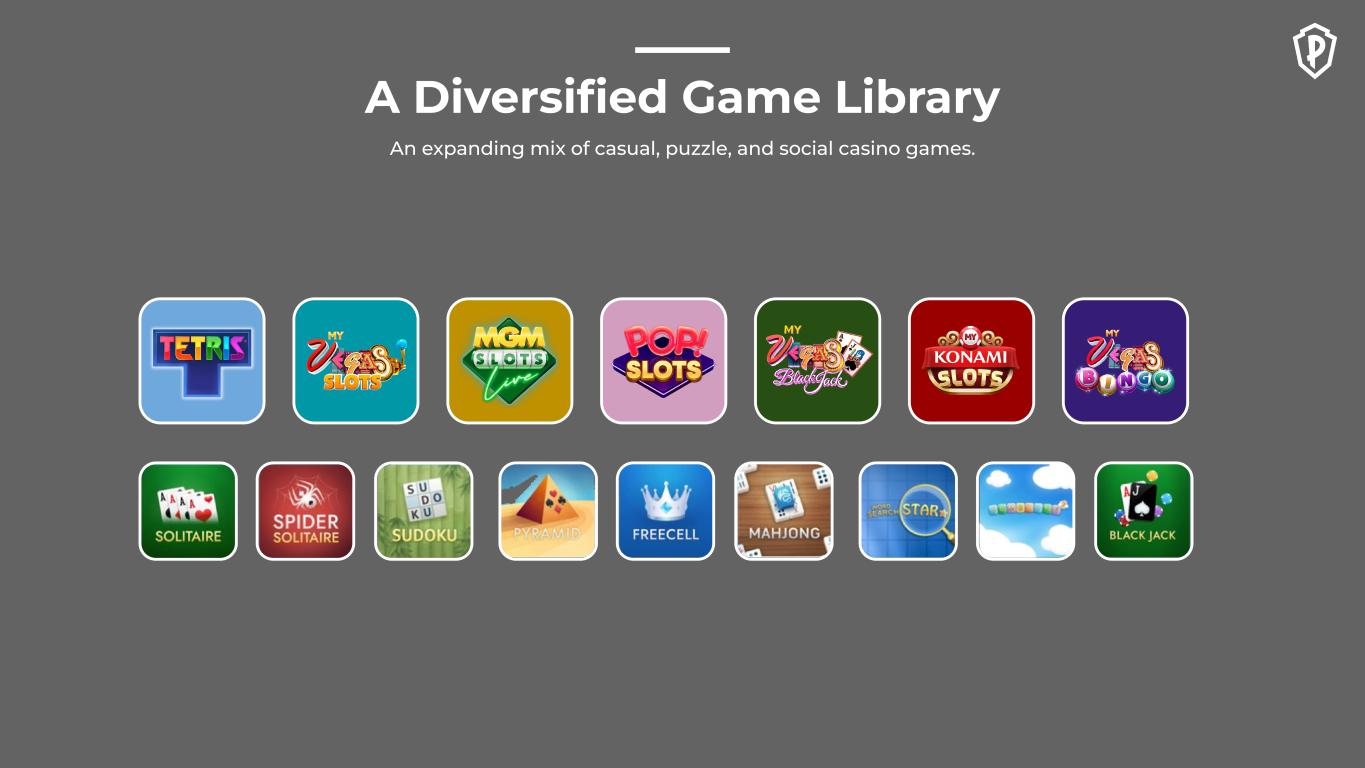
An expanding mix of casual, puzzle, and social casino games. A Diversified Game Library
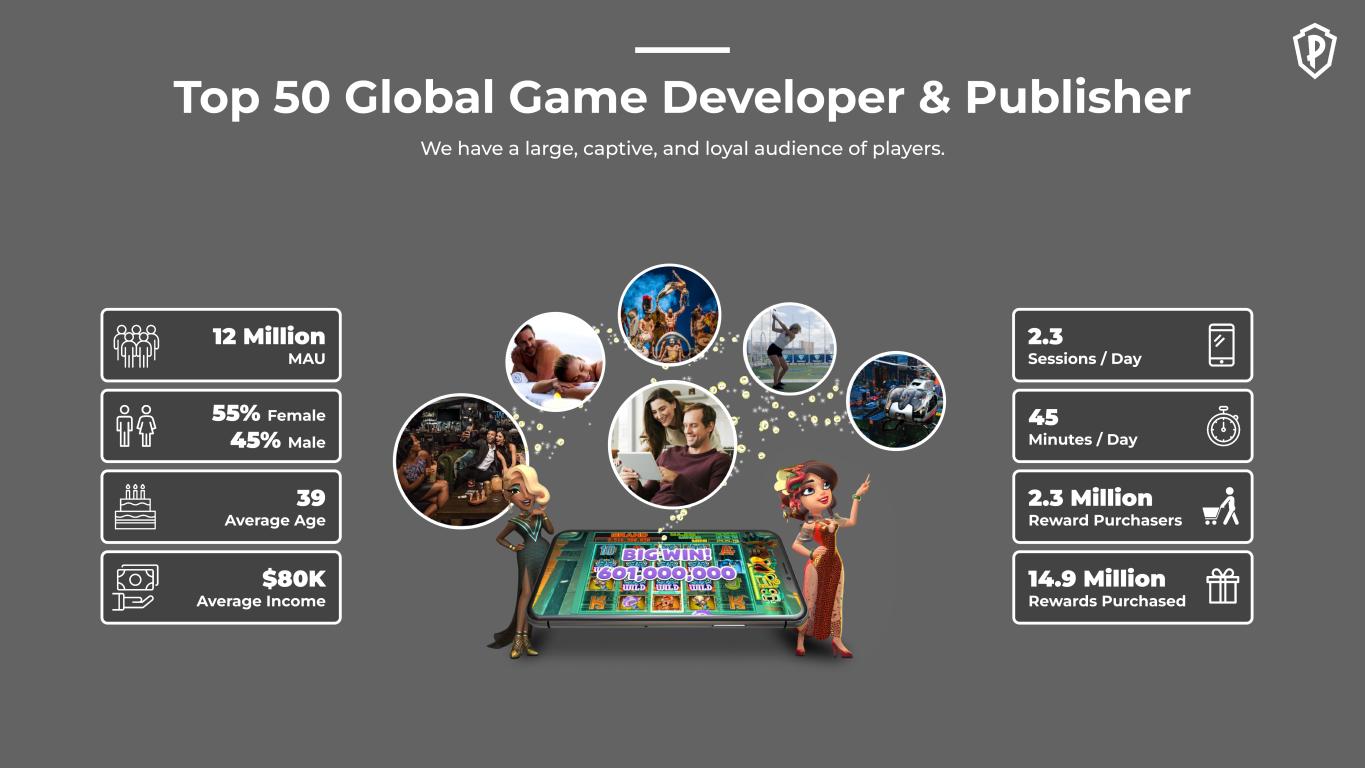
12 Million MAU 55% Female 45% Male 39 Average Age $80K Average Income 2.3 Sessions / Day 45 Minutes / Day 2.3 Million Reward Purchasers 14.9 Million Rewards Purchased We have a large, captive, and loyal audience of players. Top 50 Global Game Developer & Publisher
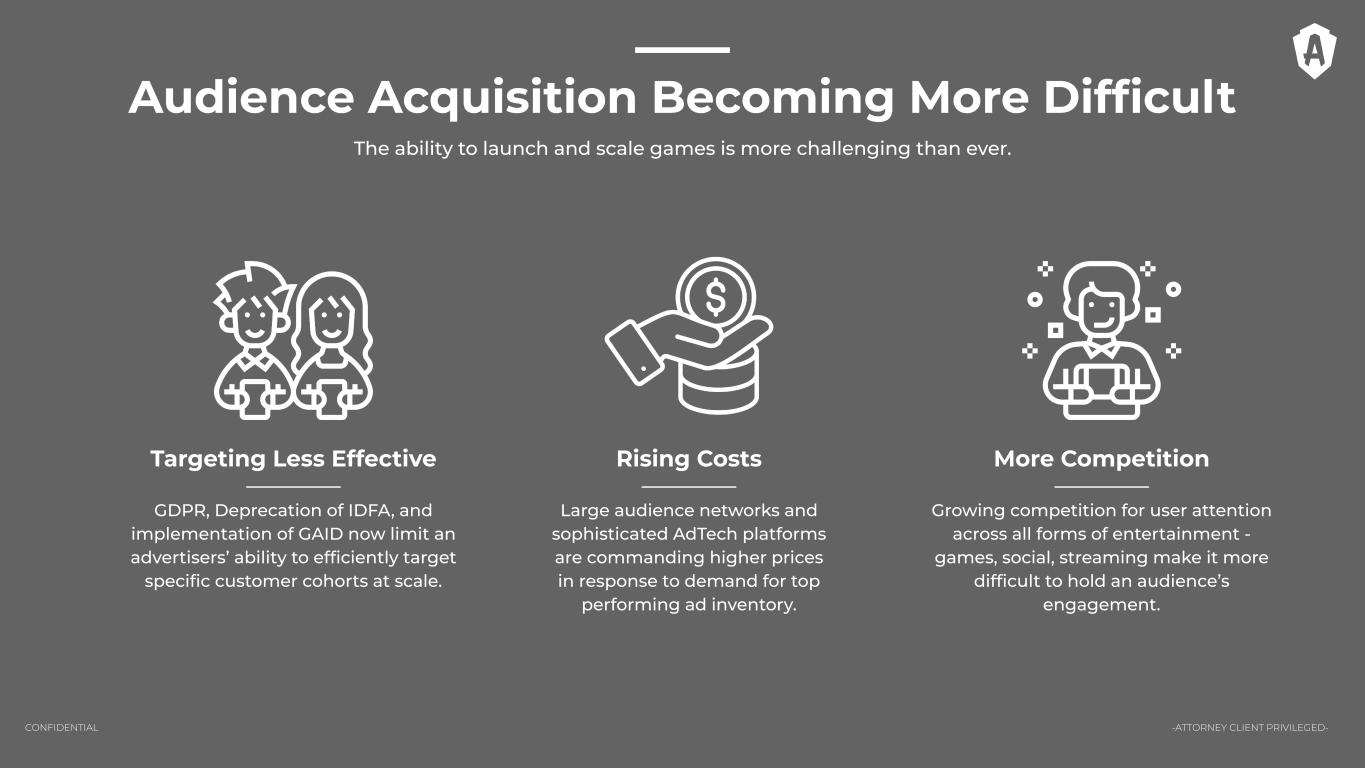
The ability to launch and scale games is more challenging than ever. -ATTORNEY CLIENT PRIVILEGED-CONFIDENTIAL More Competition Growing competition for user attention across all forms of entertainment - games, social, streaming make it more difficult to hold an audience’s engagement. Targeting Less Effective GDPR, Deprecation of IDFA, and implementation of GAID now limit an advertisers’ ability to efficiently target specific customer cohorts at scale. Rising Costs Large audience networks and sophisticated AdTech platforms are commanding higher prices in response to demand for top performing ad inventory. Audience Acquisition Becoming More Difficult
For apps and brands, retention of existing customers is now more important than ever.
playAWARDS is a comprehensive retention and engagement solution for brands and mobile apps. -ATTORNEY CLIENT PRIVILEGED-CONFIDENTIAL
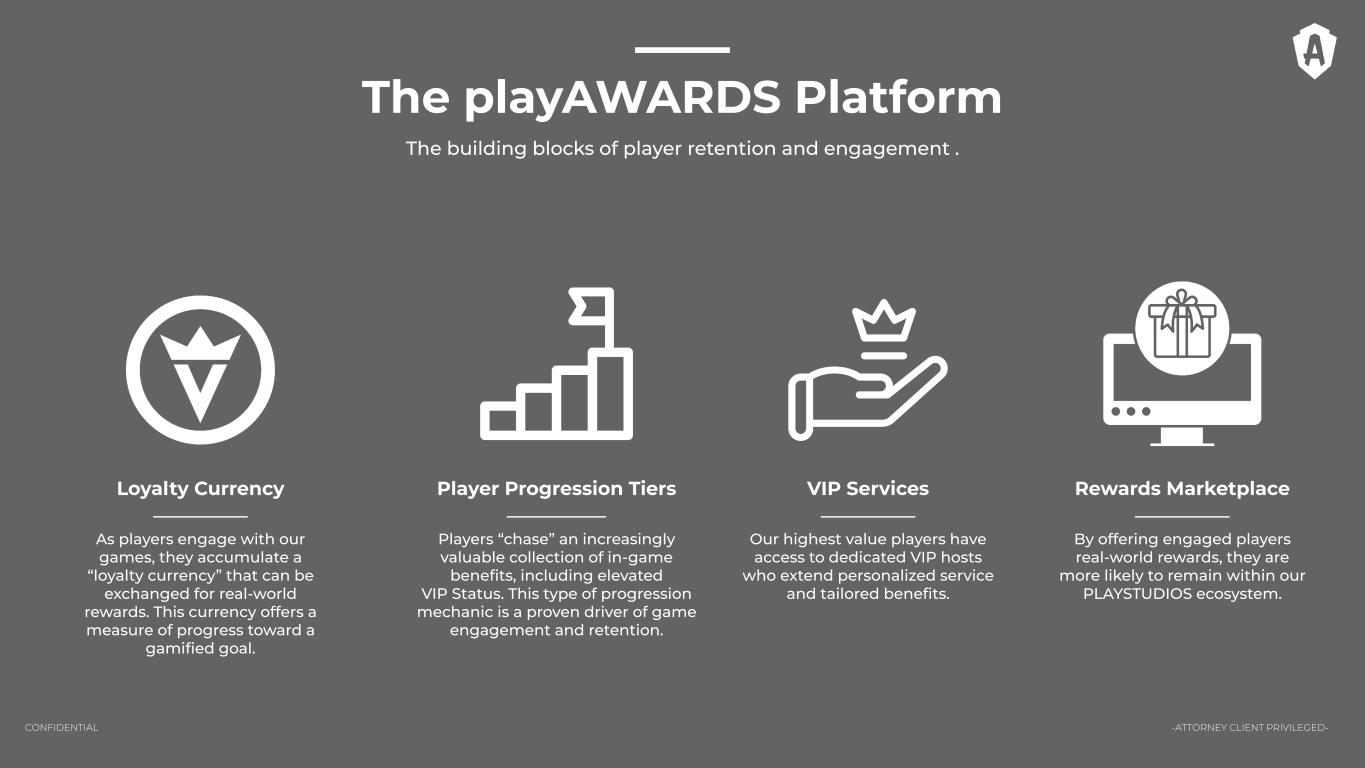
The playAWARDS Platform -ATTORNEY CLIENT PRIVILEGED-CONFIDENTIAL Player Progression Tiers Players “chase” an increasingly valuable collection of in-game benefits, including elevated VIP Status. This type of progression mechanic is a proven driver of game engagement and retention. Rewards Marketplace By offering engaged players real-world rewards, they are more likely to remain within our PLAYSTUDIOS ecosystem. Loyalty Currency As players engage with our games, they accumulate a “loyalty currency” that can be exchanged for real-world rewards. This currency offers a measure of progress toward a gamified goal. VIP Services Our highest value players have access to dedicated VIP hosts who extend personalized service and tailored benefits. The building blocks of player retention and engagement .
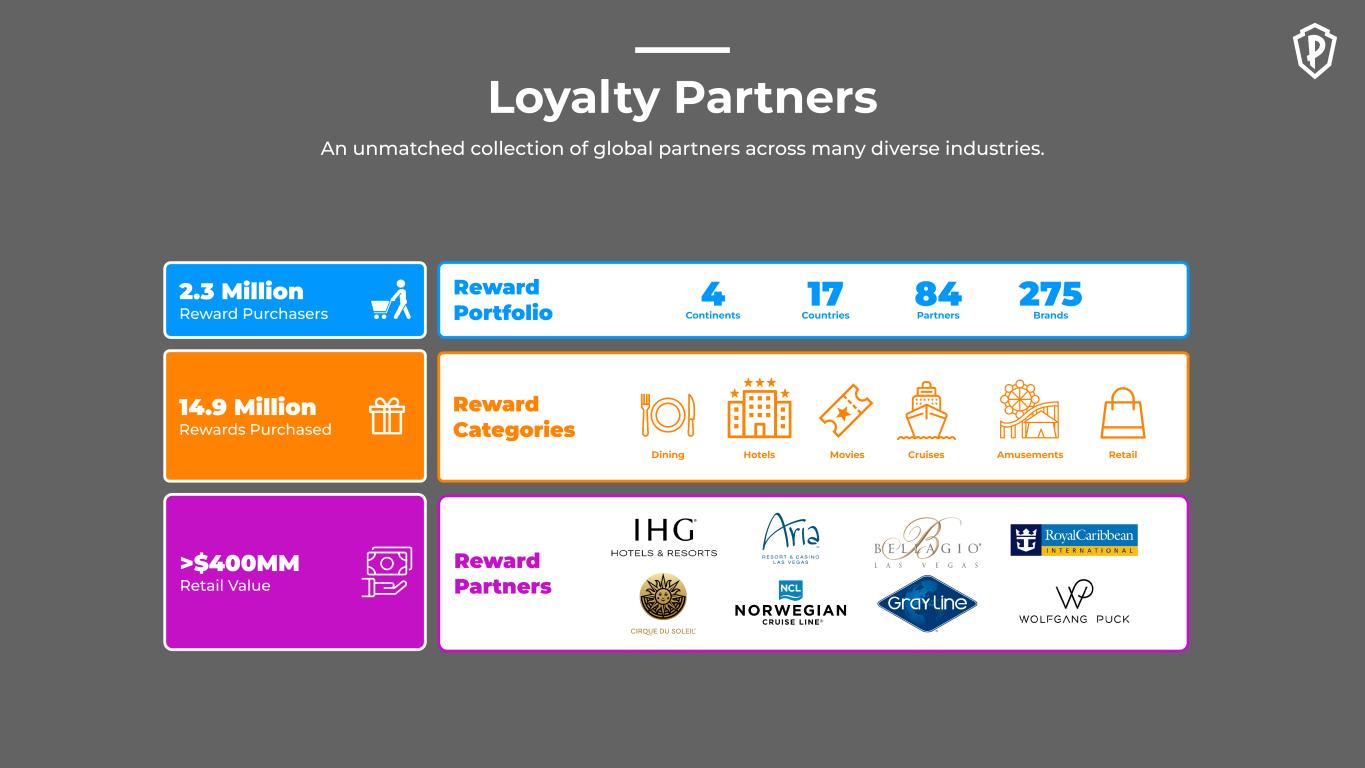
Reward Partners 2.3 Million Reward Purchasers >$400MM Retail Value Reward Portfolio Reward Categories 14.9 Million Rewards Purchased 4 Continents 17 Countries 84 Partners 275 Brands Dining Hotels Movies Cruises Amusements Retail An unmatched collection of global partners across many diverse industries. Loyalty Partners
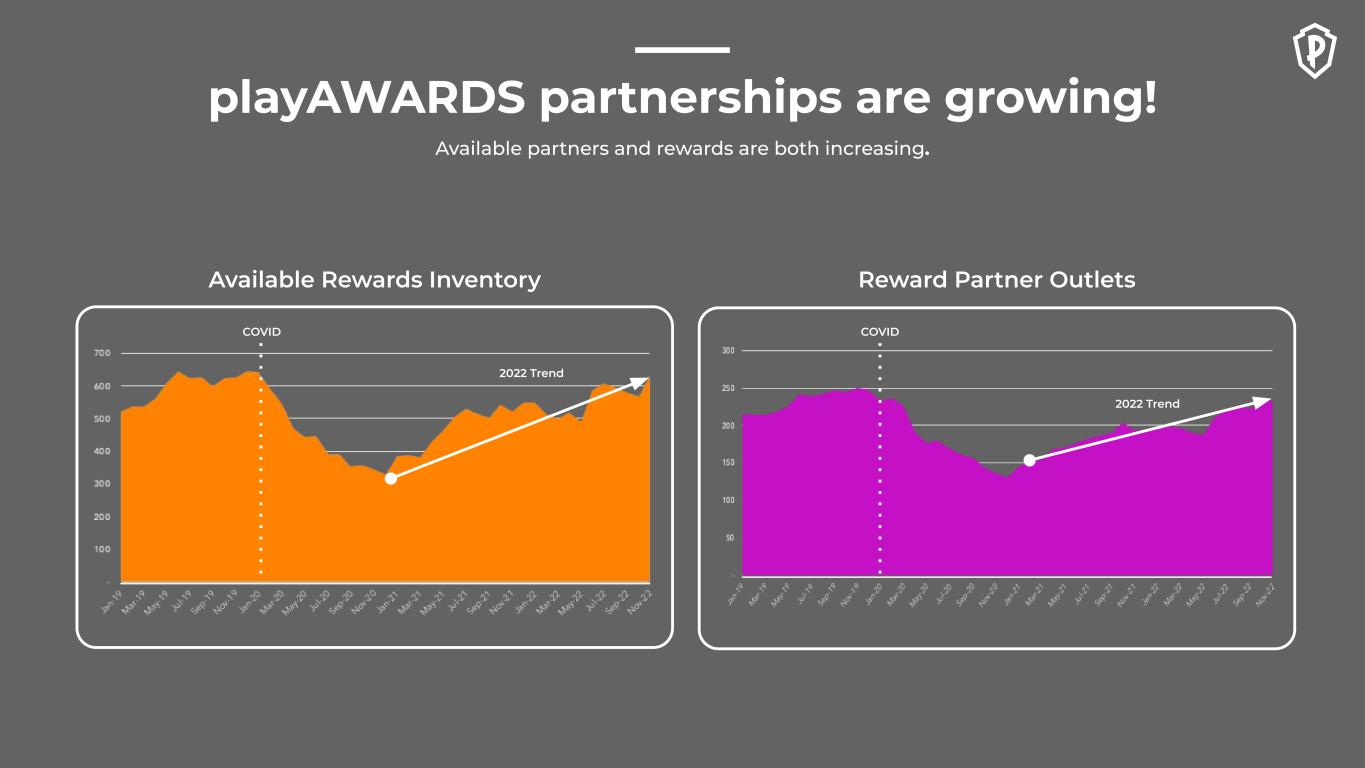
Available Rewards Inventory Reward Partner Outlets COVID COVID 2022 Trend 2022 Trend Available partners and rewards are both increasing. playAWARDS partnerships are growing!
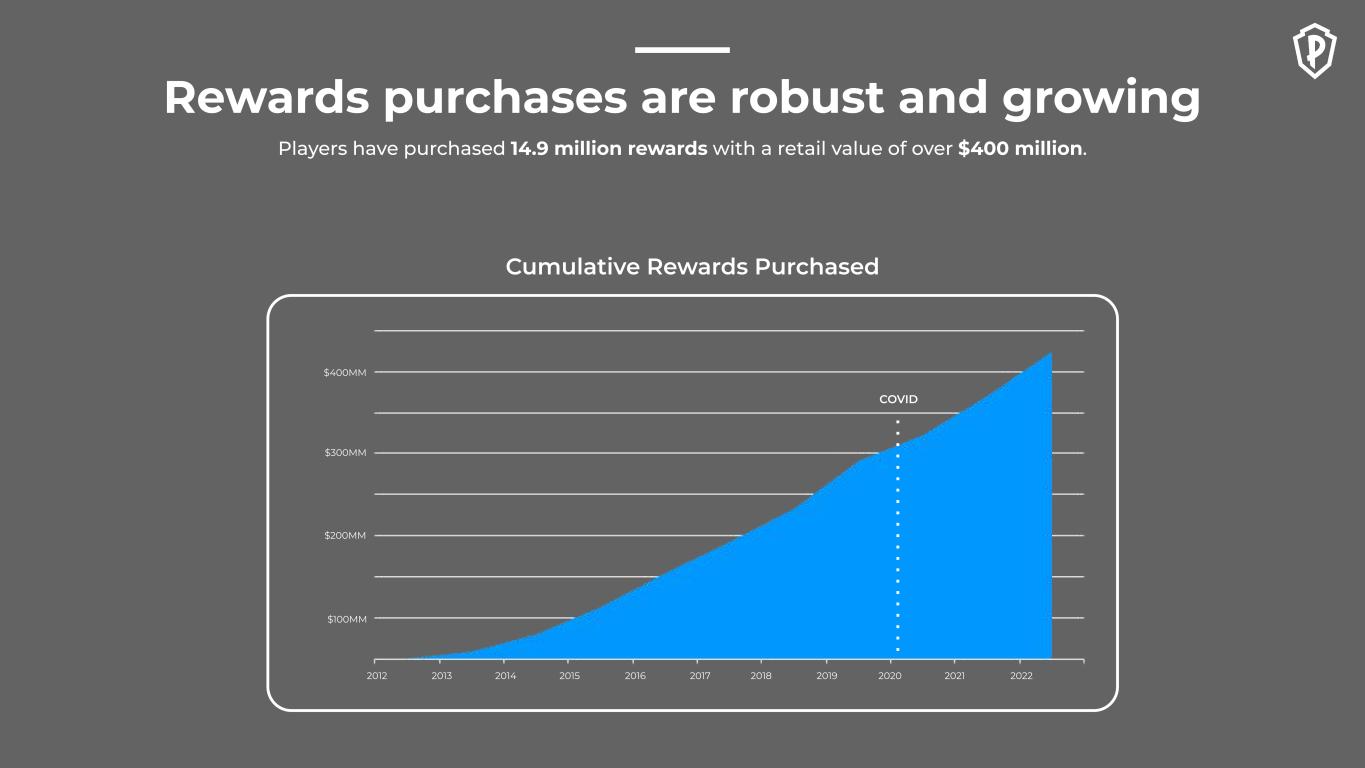
Cumulative Rewards Purchased COVID Players have purchased 14.9 million rewards with a retail value of over $400 million. Rewards purchases are robust and growing $400MM $300MM $200MM $100MM 2012 2013 2014 2015 2016 2017 2018 2019 2020 2021 2022
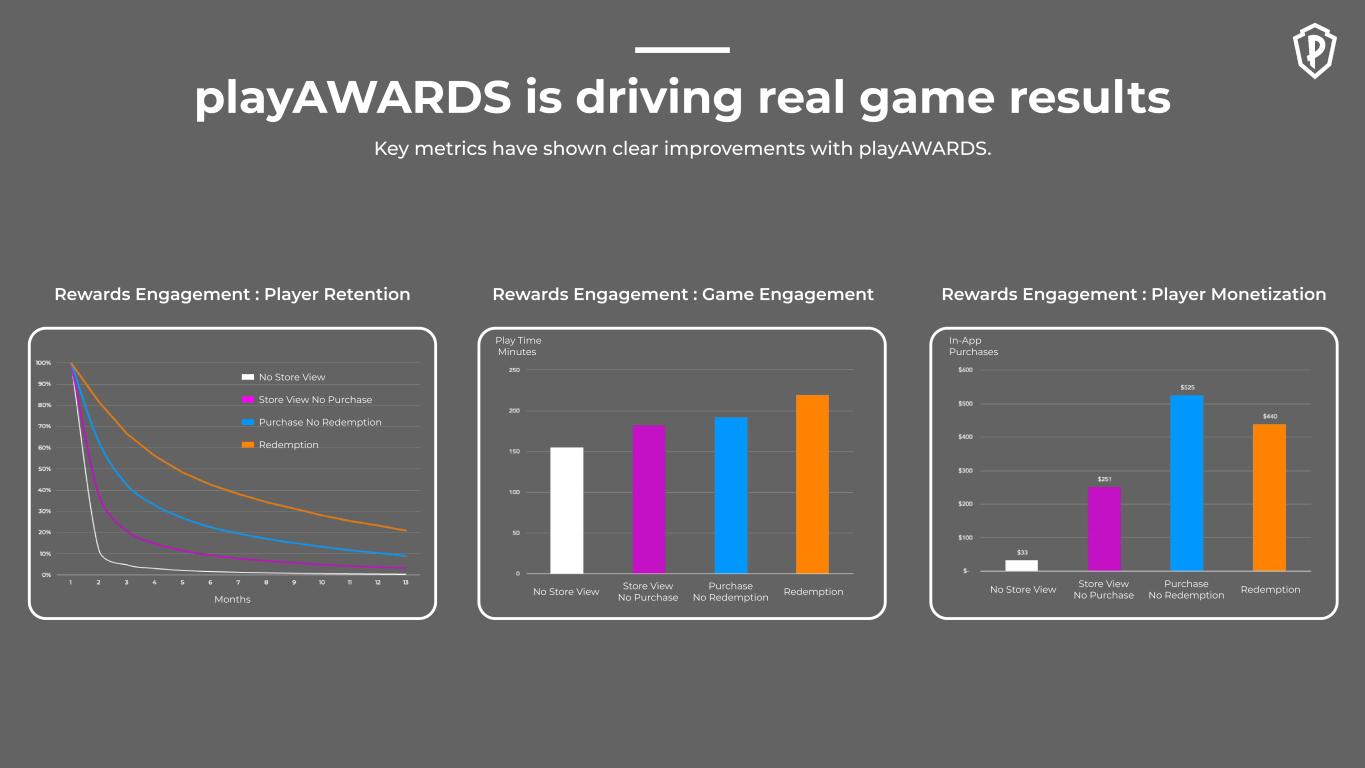
Rewards Engagement : Player Retention No Store View Store View No Purchase Purchase No Redemption Redemption Rewards Engagement : Game Engagement Play Time Minutes RedemptionNo Store View Store View No Purchase Purchase No Redemption Rewards Engagement : Player Monetization In-App Purchases Key metrics have shown clear improvements with playAWARDS. playAWARDS is driving real game results No Store View Store View No Purchase Purchase No Redemption Redemption Months
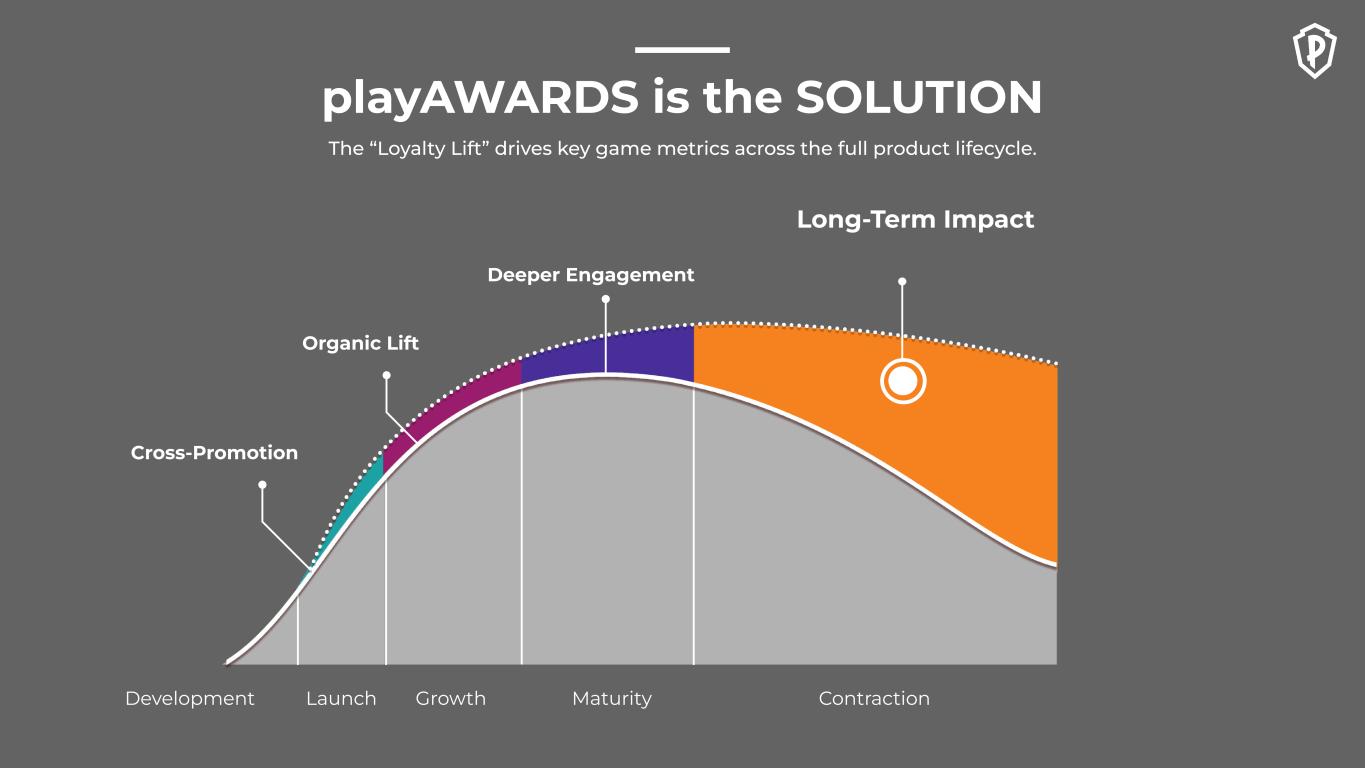
Long-Term Impact Cross-Promotion Organic Lift Deeper Engagement Development Launch Growth Maturity Contraction The “Loyalty Lift” drives key game metrics across the full product lifecycle. playAWARDS is the SOLUTION

The Opportunity
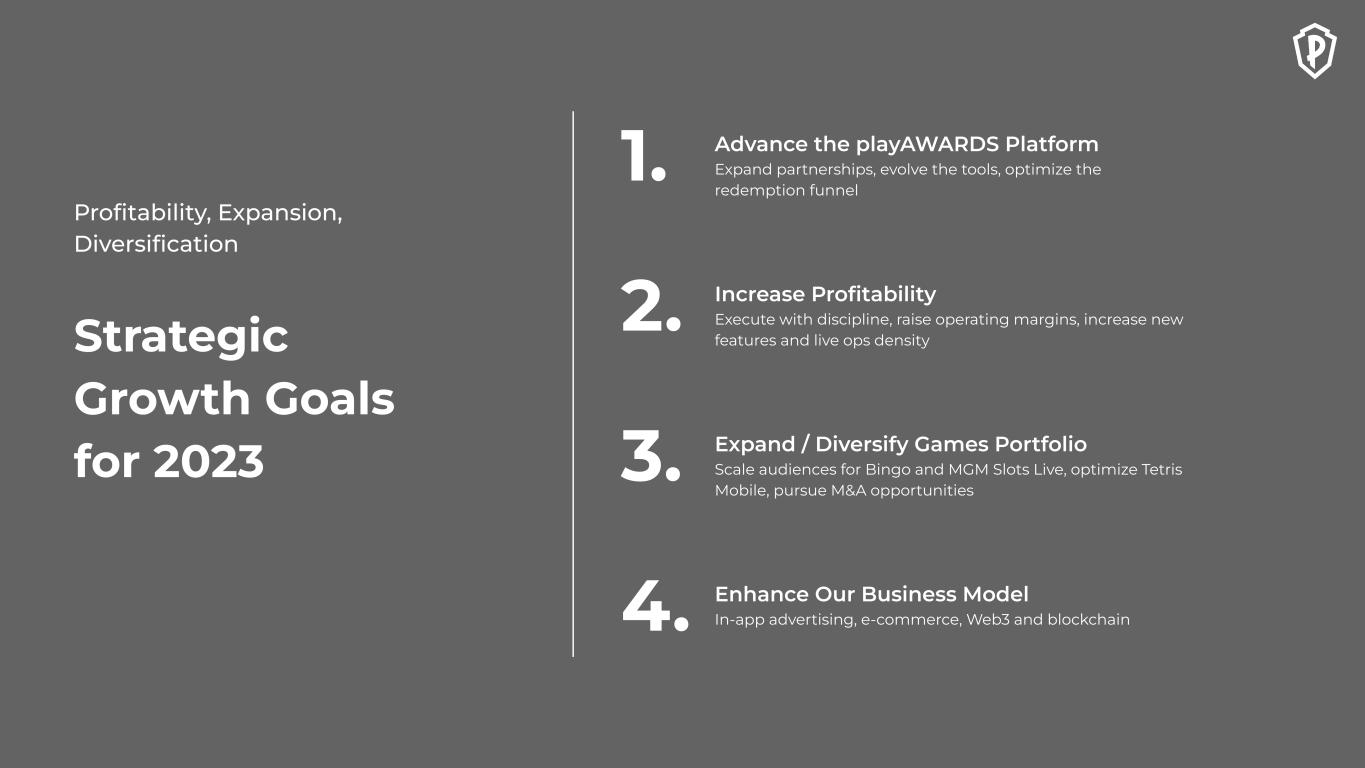
1. 2. 3. Advance the playAWARDS Platform Expand partnerships, evolve the tools, optimize the redemption funnel Increase Profitability Execute with discipline, raise operating margins, increase new features and live ops density Expand / Diversify Games Portfolio Scale audiences for Bingo and MGM Slots Live, optimize Tetris Mobile, pursue M&A opportunities 4. Enhance Our Business Model In-app advertising, e-commerce, Web3 and blockchain Strategic Growth Goals for 2023 Profitability, Expansion, Diversification
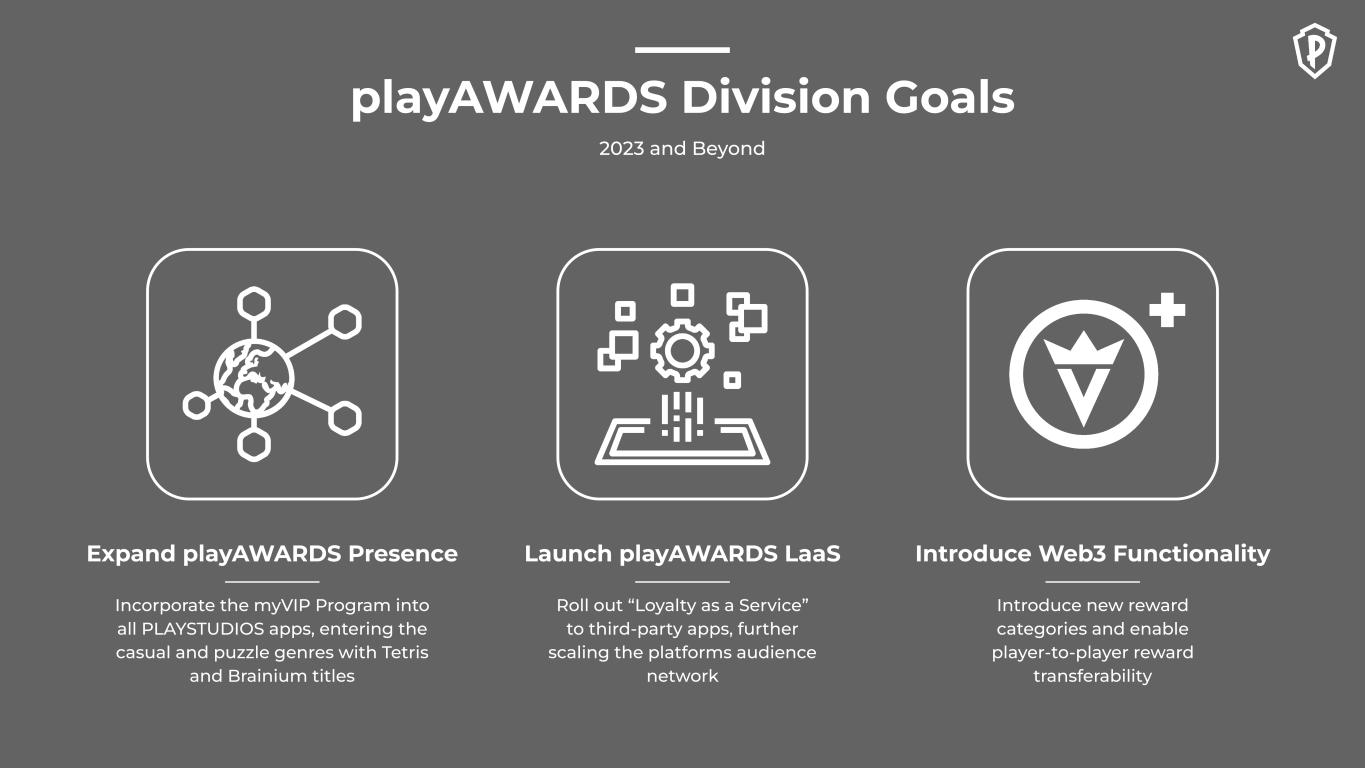
Expand playAWARDS Presence Incorporate the myVIP Program into all PLAYSTUDIOS apps, entering the casual and puzzle genres with Tetris and Brainium titles 2023 and Beyond playAWARDS Division Goals Launch playAWARDS LaaS Roll out “Loyalty as a Service” to third-party apps, further scaling the platforms audience network Introduce Web3 Functionality Introduce new reward categories and enable player-to-player reward transferability +
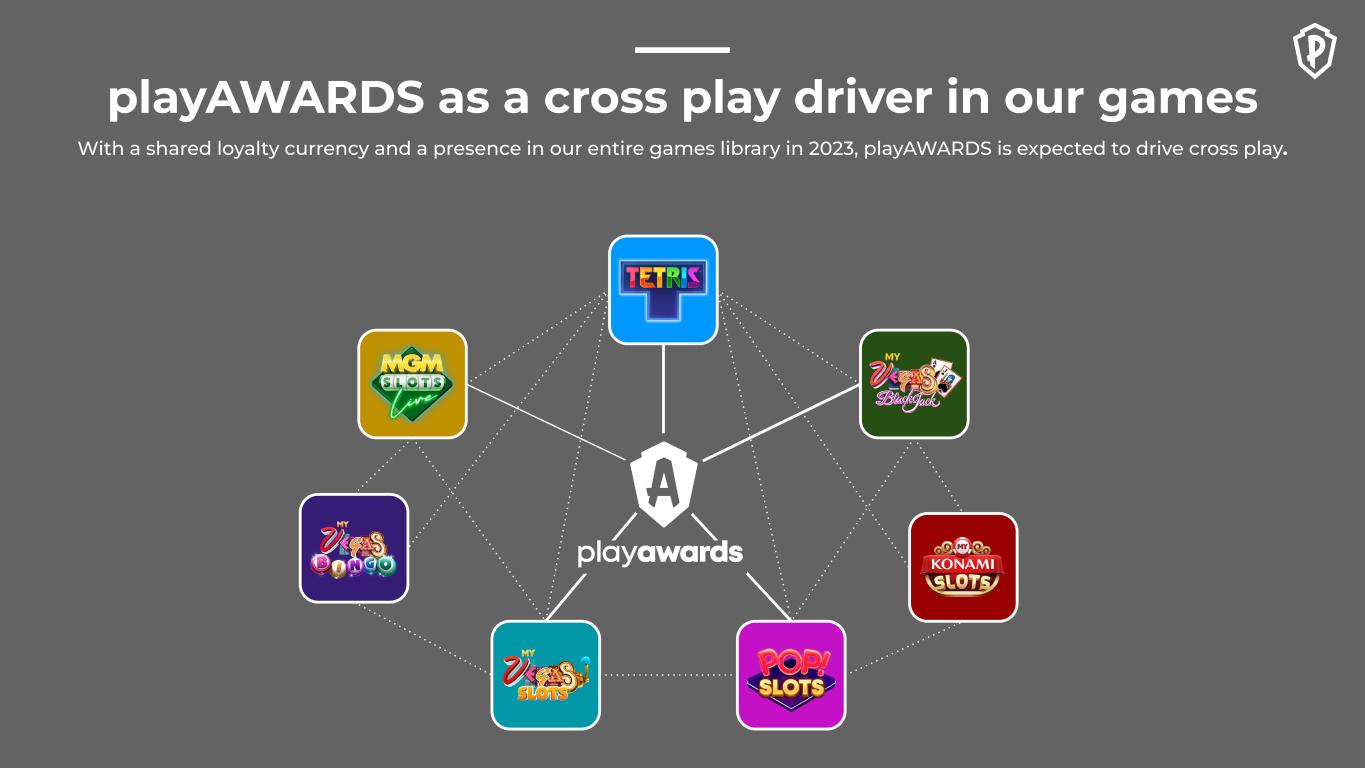
With a shared loyalty currency and a presence in our entire games library in 2023, playAWARDS is expected to drive cross play. playAWARDS as a cross play driver in our games
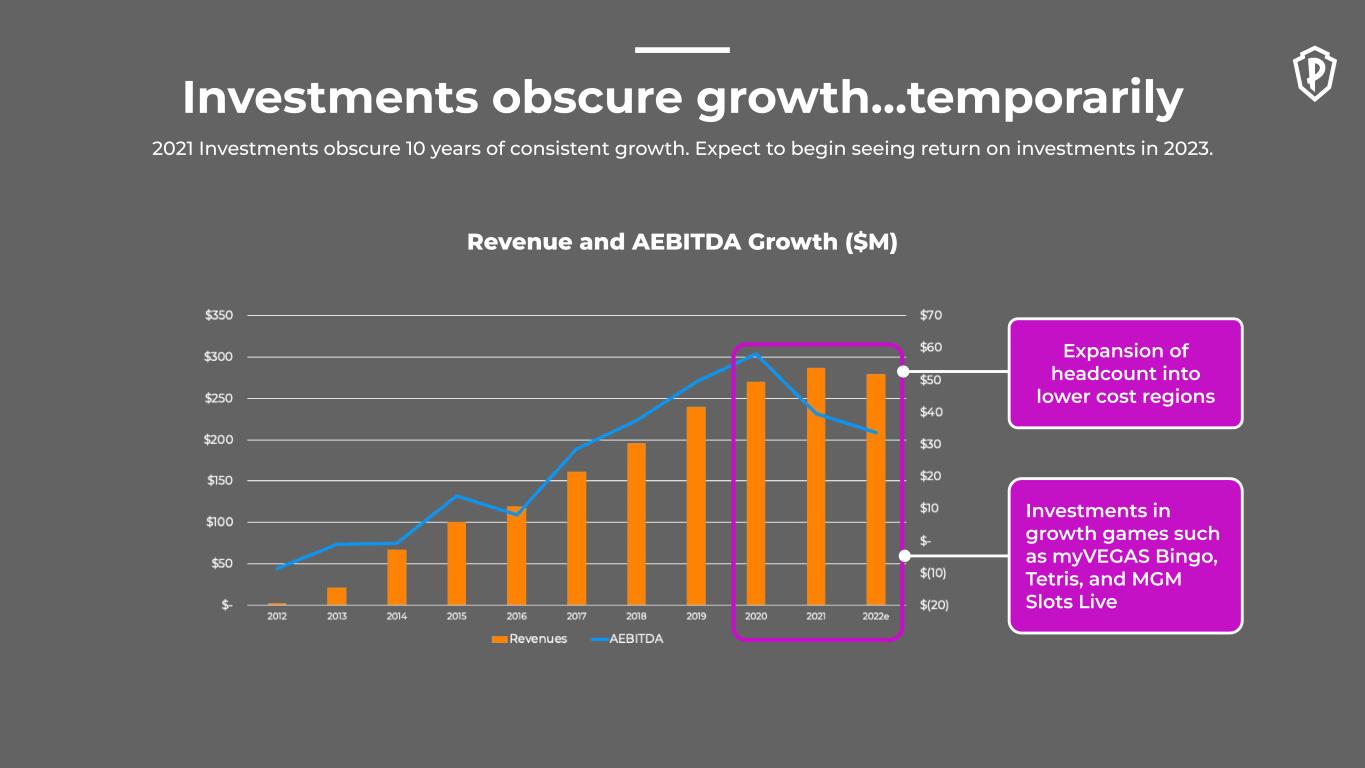
2021 Investments obscure 10 years of consistent growth. Expect to begin seeing return on investments in 2023. Investments obscure growth…temporarily Revenue and AEBITDA Growth ($M) Expansion of headcount into lower cost regions Investments in growth games such as myVEGAS Bingo, Tetris, and MGM Slots Live
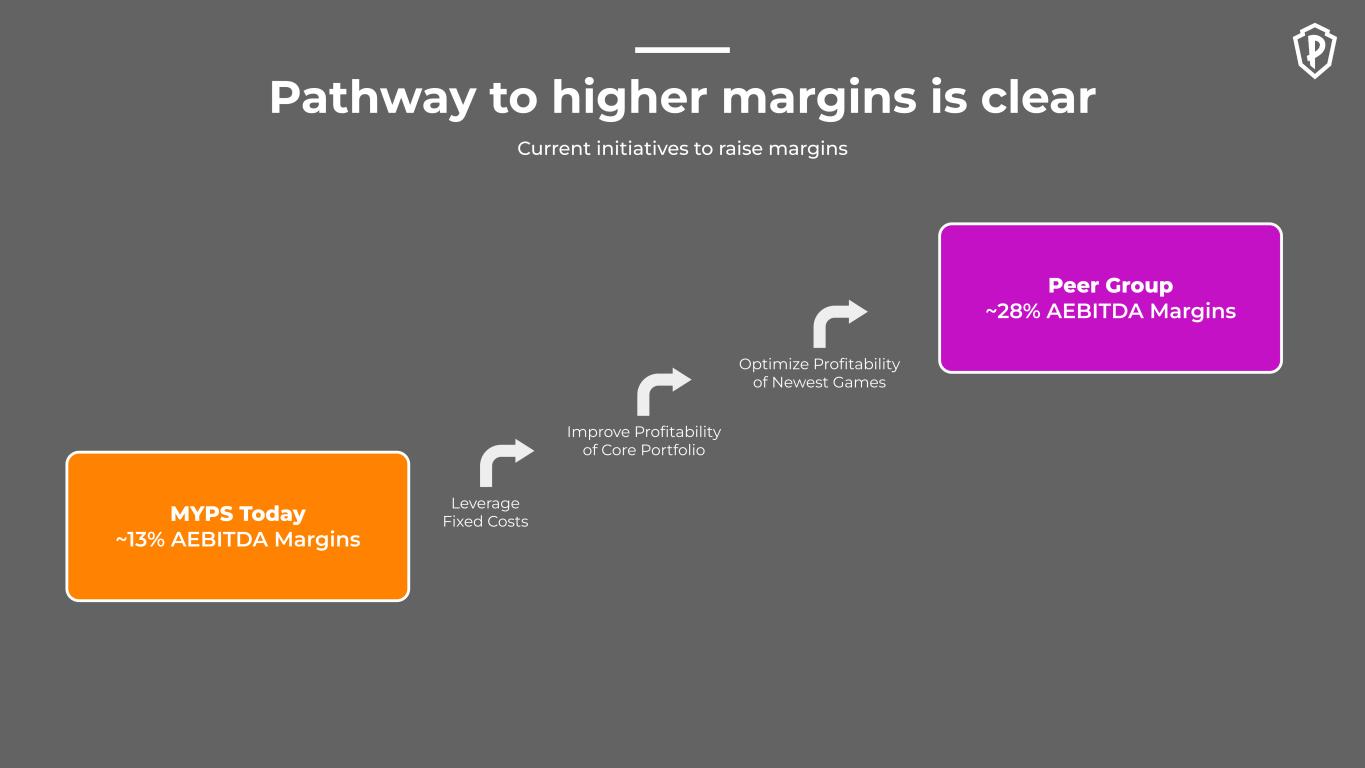
MYPS Today ~13% AEBITDA Margins Peer Group ~28% AEBITDA Margins Leverage Fixed Costs Optimize Profitability of Newest Games Current initiatives to raise margins Pathway to higher margins is clear Improve Profitability of Core Portfolio
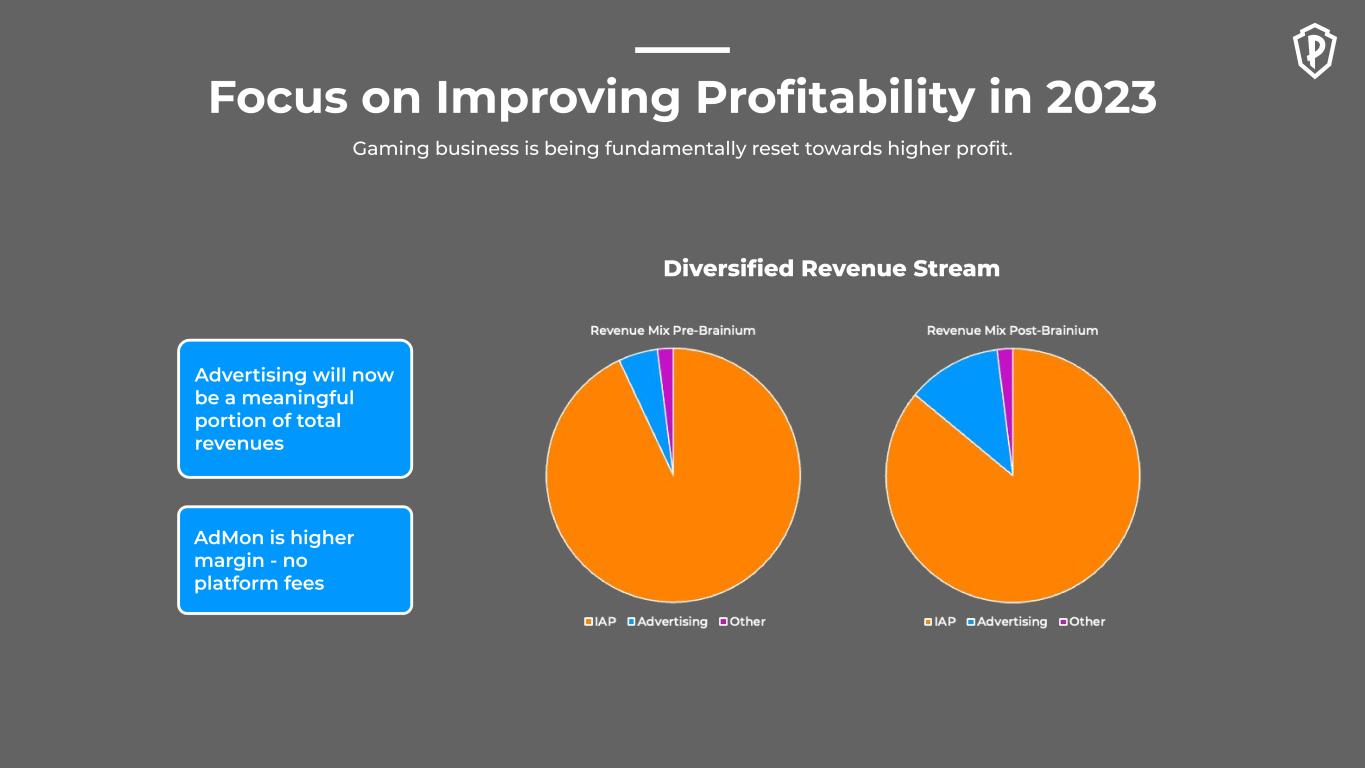
Gaming business is being fundamentally reset towards higher profit. Focus on Improving Profitability in 2023 Advertising will now be a meaningful portion of total revenues AdMon is higher margin - no platform fees Diversified Revenue Stream
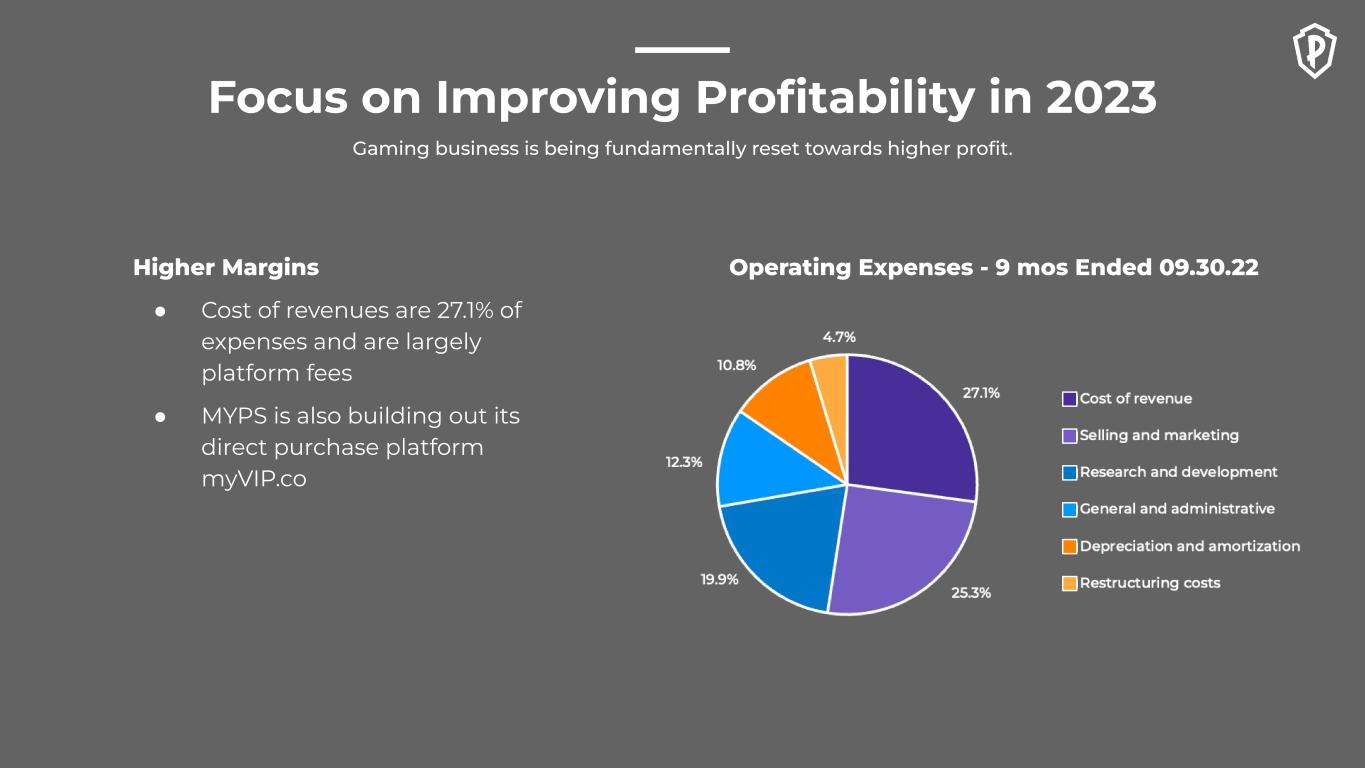
Gaming business is being fundamentally reset towards higher profit. Focus on Improving Profitability in 2023 Higher Margins ● Cost of revenues are 27.1% of expenses and are largely platform fees ● MYPS is also building out its direct purchase platform myVIP.co Operating Expenses - 9 mos Ended 09.30.22
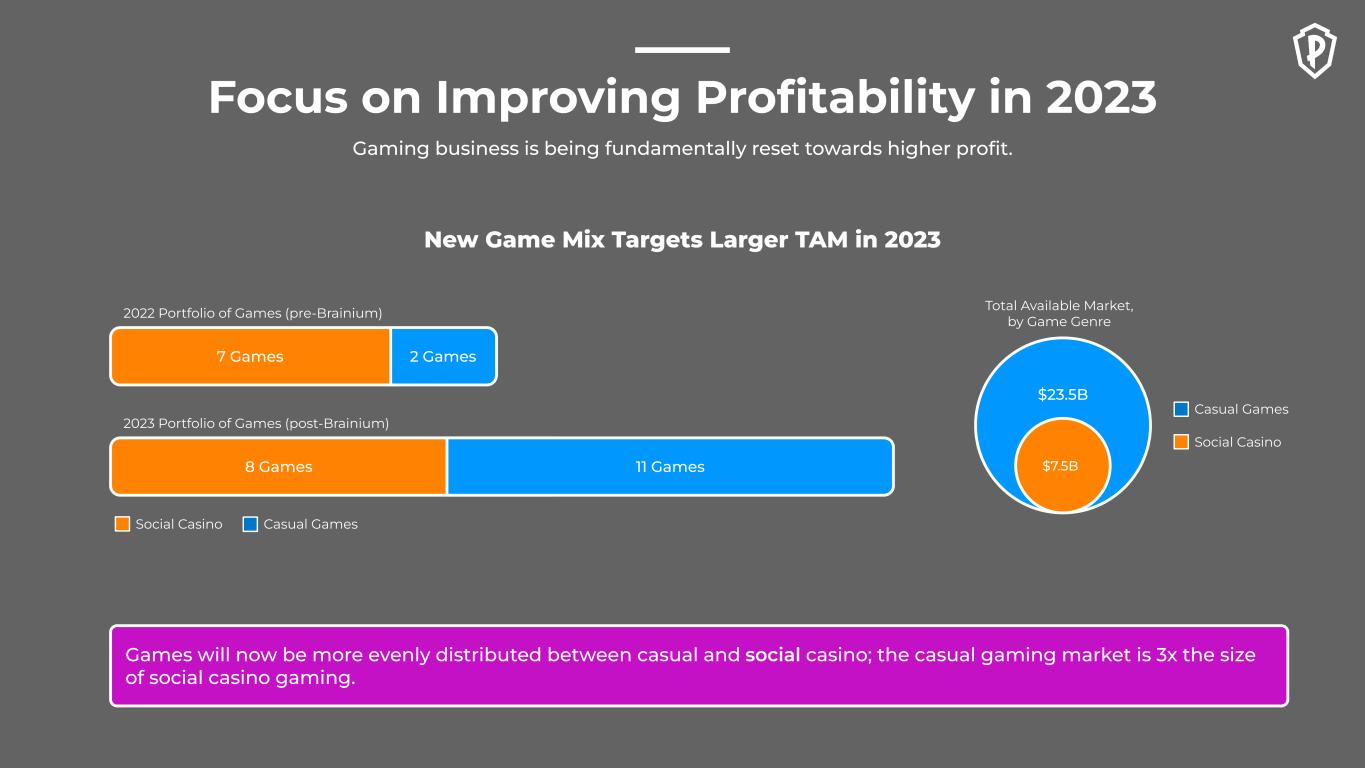
Gaming business is being fundamentally reset towards higher profit. Focus on Improving Profitability in 2023 Games will now be more evenly distributed between casual and social casino; the casual gaming market is 3x the size of social casino gaming. New Game Mix Targets Larger TAM in 2023 2023 Portfolio of Games (post-Brainium) 2022 Portfolio of Games (pre-Brainium) Social Casino Casual Games $7.5B Total Available Market, by Game Genre $23.5B 7 Games 2 Games 8 Games 11 Games Social Casino Casual Games
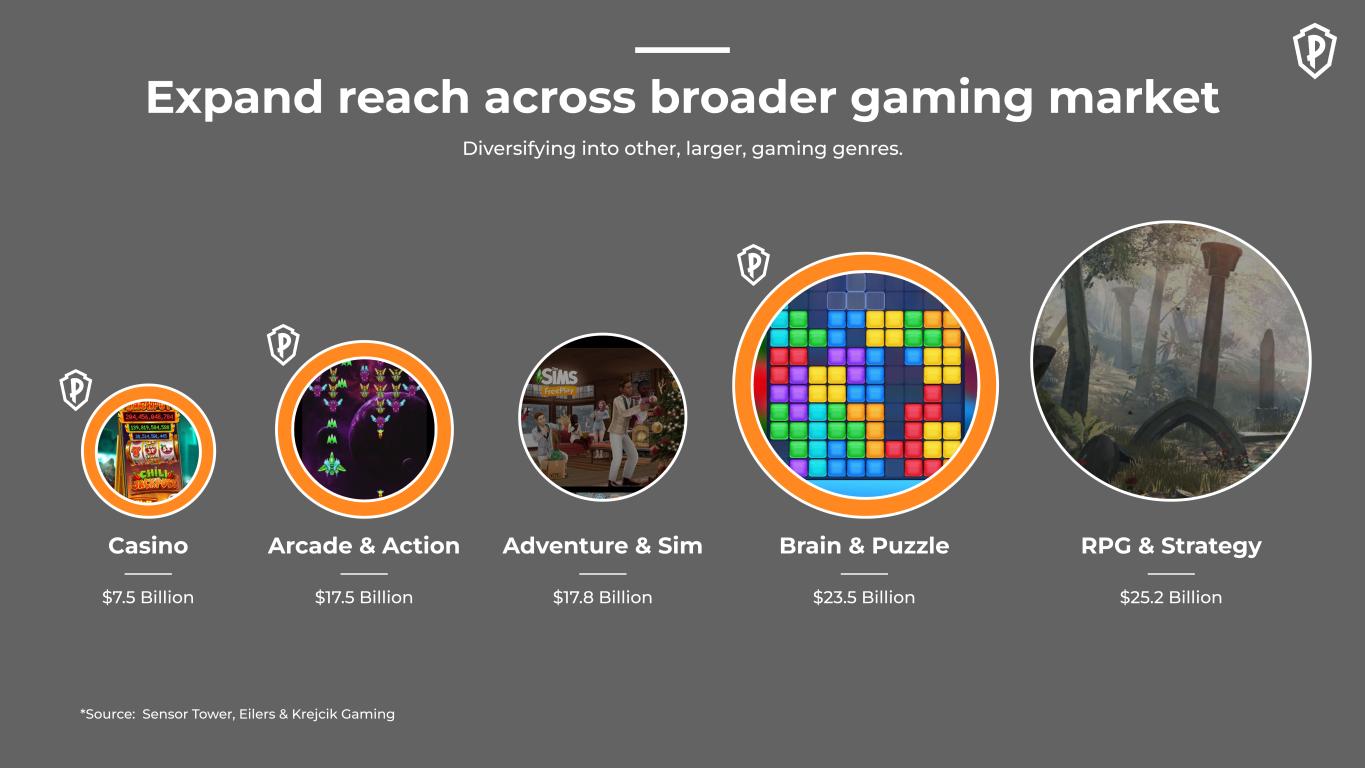
Casino $7.5 Billion Arcade & Action $17.5 Billion Adventure & Sim $17.8 Billion RPG & Strategy $25.2 Billion Brain & Puzzle $23.5 Billion Diversifying into other, larger, gaming genres. Expand reach across broader gaming market *Source: Sensor Tower, Eilers & Krejcik Gaming
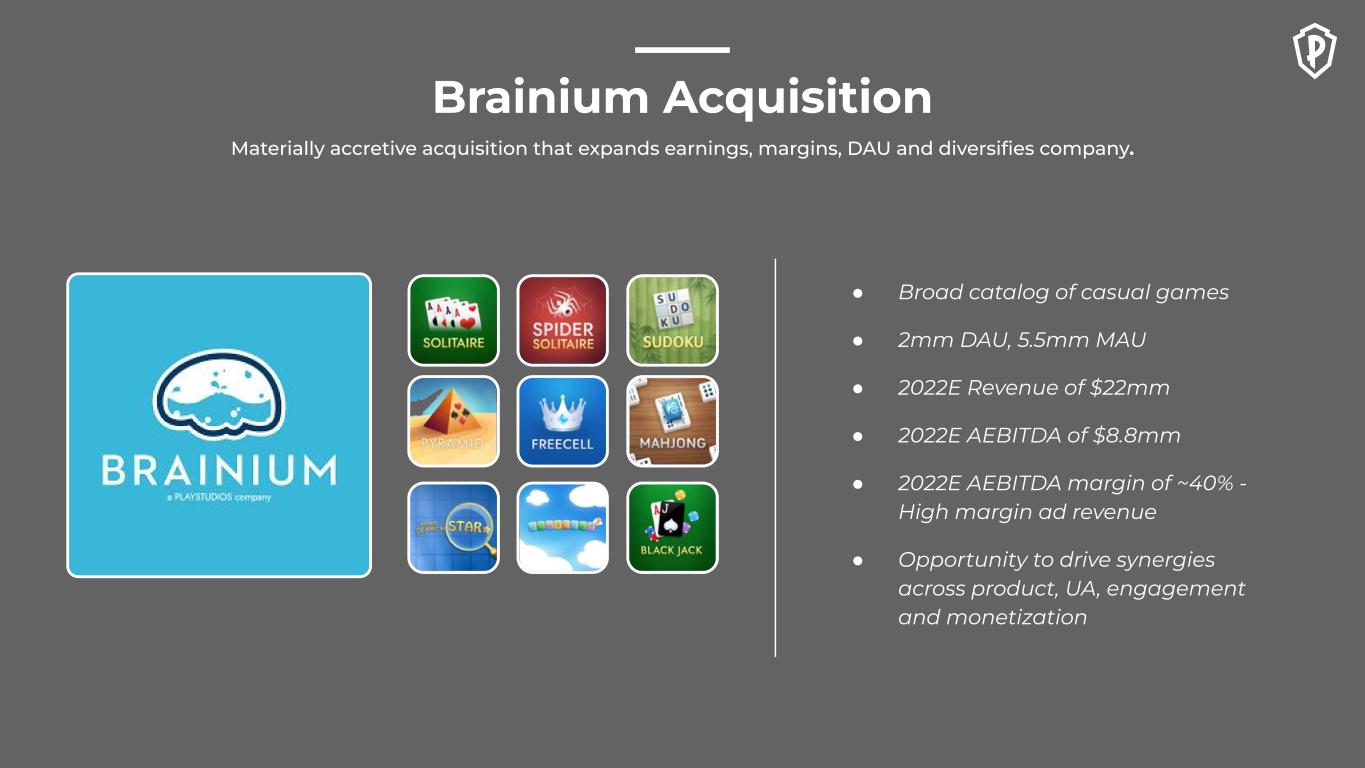
● Broad catalog of casual games ● 2mm DAU, 5.5mm MAU ● 2022E Revenue of $22mm ● 2022E AEBITDA of $8.8mm ● 2022E AEBITDA margin of ~40% - High margin ad revenue ● Opportunity to drive synergies across product, UA, engagement and monetization Materially accretive acquisition that expands earnings, margins, DAU and diversifies company. Brainium Acquisition
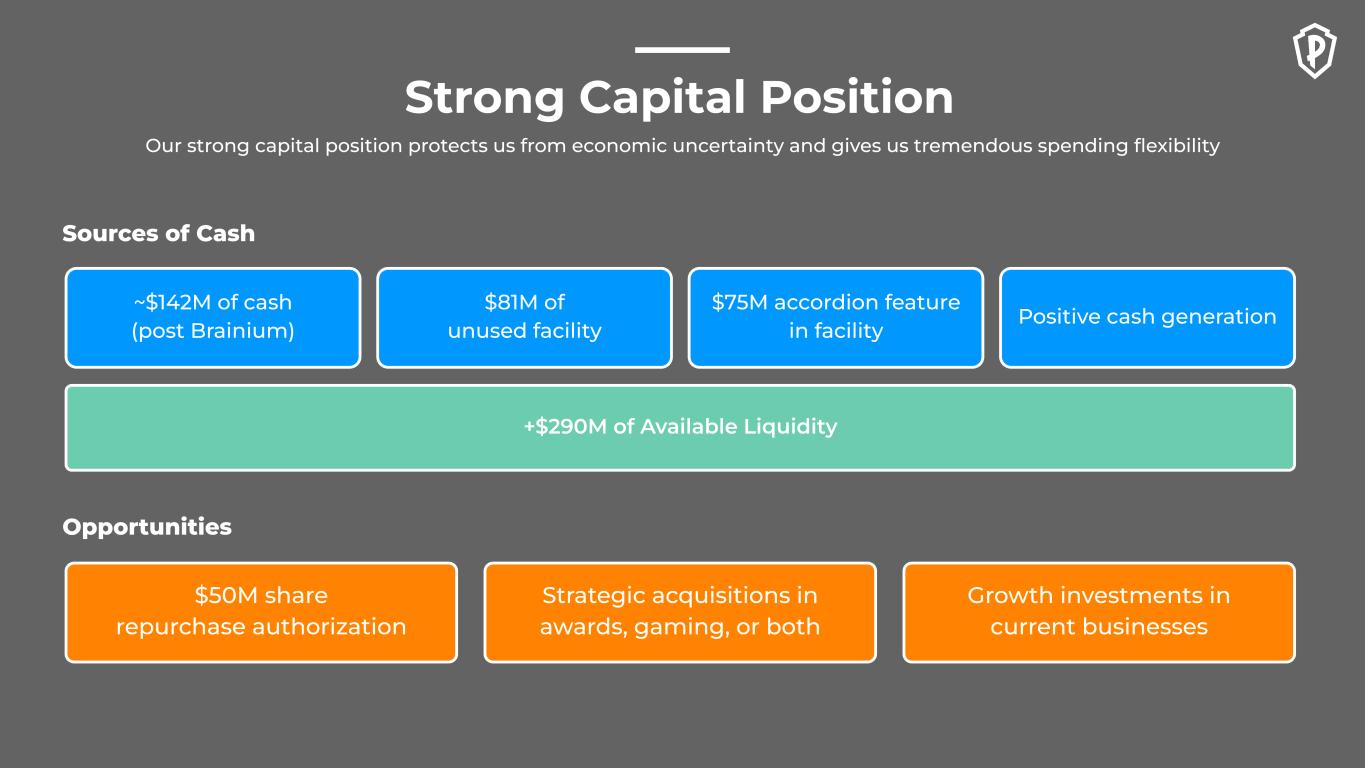
Our strong capital position protects us from economic uncertainty and gives us tremendous spending flexibility Strong Capital Position $50M share repurchase authorization ~$142M of cash (post Brainium) +$290M of Available Liquidity Sources of Cash Opportunities $81M of unused facility $75M accordion feature in facility Positive cash generation Strategic acquisitions in awards, gaming, or both Growth investments in current businesses

Financials
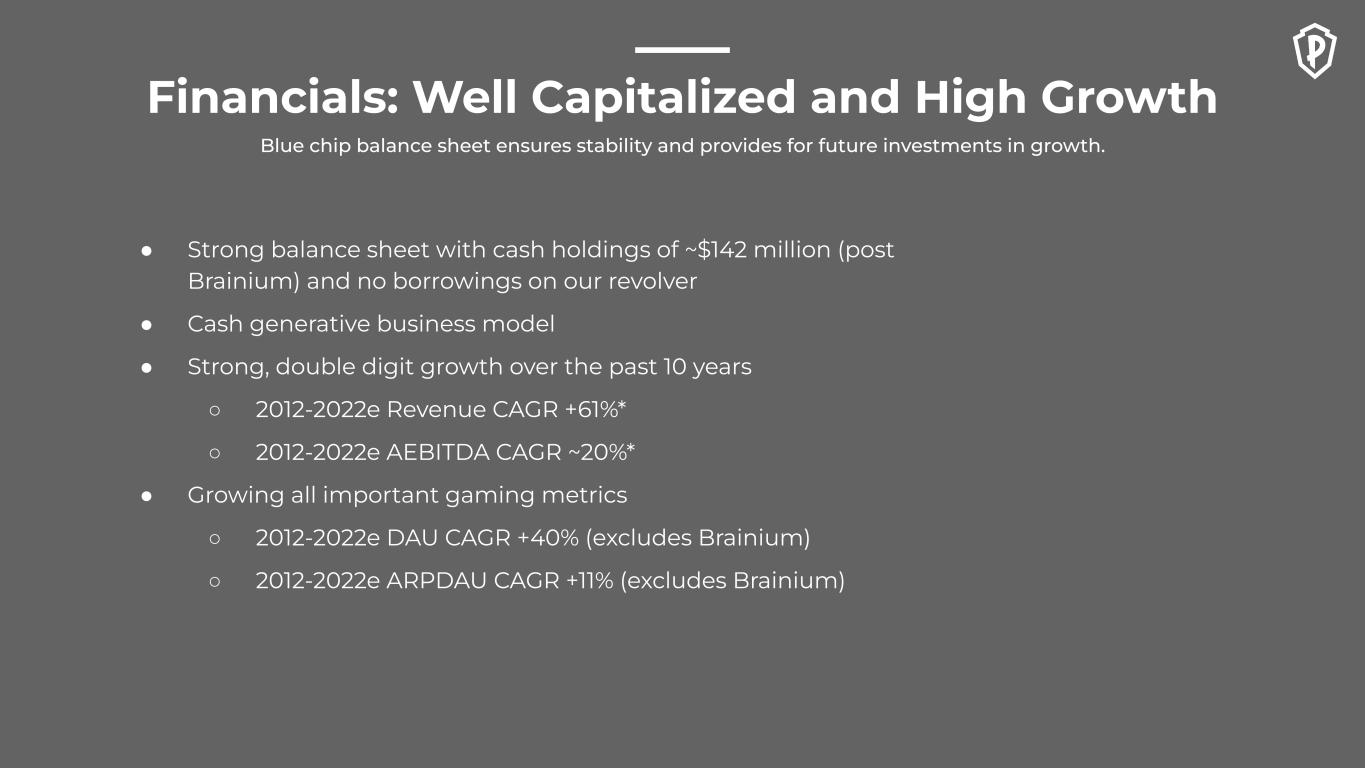
Blue chip balance sheet ensures stability and provides for future investments in growth. Financials: Well Capitalized and High Growth ● Strong balance sheet with cash holdings of ~$142 million (post Brainium) and no borrowings on our revolver ● Cash generative business model ● Strong, double digit growth over the past 10 years ○ 2012-2022e Revenue CAGR +61%* ○ 2012-2022e AEBITDA CAGR ~20%* ● Growing all important gaming metrics ○ 2012-2022e DAU CAGR +40% (excludes Brainium) ○ 2012-2022e ARPDAU CAGR +11% (excludes Brainium)
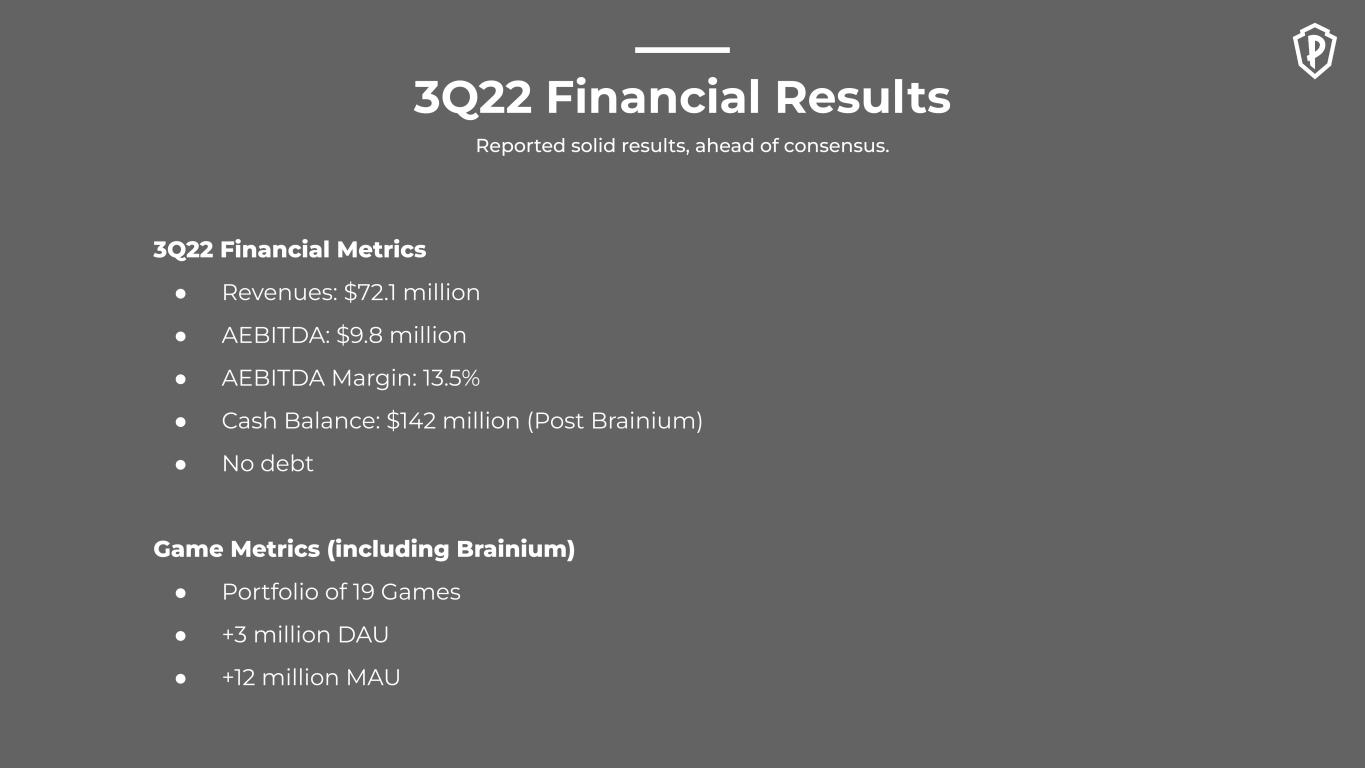
3Q22 Financial Metrics ● Revenues: $72.1 million ● AEBITDA: $9.8 million ● AEBITDA Margin: 13.5% ● Cash Balance: $142 million (Post Brainium) ● No debt Game Metrics (including Brainium) ● Portfolio of 19 Games ● +3 million DAU ● +12 million MAU Reported solid results, ahead of consensus. 3Q22 Financial Results
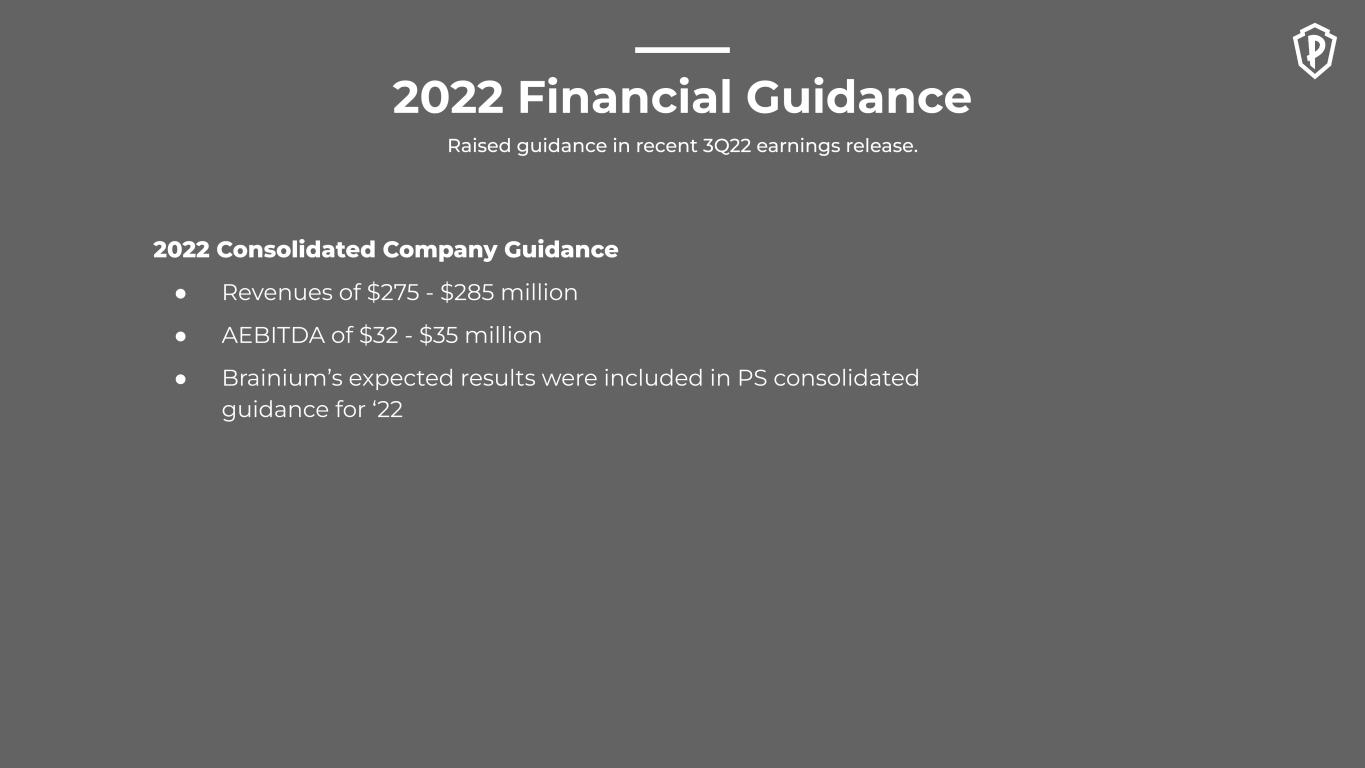
2022 Consolidated Company Guidance ● Revenues of $275 - $285 million ● AEBITDA of $32 - $35 million ● Brainium’s expected results were included in PS consolidated guidance for ‘22 Raised guidance in recent 3Q22 earnings release. 2022 Financial Guidance
01 02 Unique Vision and Model Games players love, real-world benefits they want. Diversified Portfolio Expanding model provides for future growth. 03 04 Margin Expansion Balancing future growth with near-term margin improvement. Aligned Interests Leadership and investor interests are aligned.
THANK YOU!